 Blog
Blog
Surface temperature is not air temperature.
When a satellite passes overhead, it measures the skin of the earth: rooftops, asphalt, grass. A parking lot at 54°C does not mean the air is 54°C. It means the ground is radiating heat that makes the air above it hotter, longer. It means the surface stores energy during the day and releases it at night, keeping neighborhoods warm when they should be cooling down.
Every temperature in this piece is surface temperature, measured by Landsat 8 and 9. The numbers are higher than a weather forecast. They are also more precise and located around the city.
Surface temperature measured by Landsat 8 and 9 at 30-meter resolution. Aggregated into 200-meter hexagonal cells.
Mexico City is the host city with the wider gap in temperatures, from the coolest park to the hottest parking lot there's a difference of 26.3°C. Same city. Same day.
Estadio Akron is the hottest stadium in the tournament. It is hotter than nearly three-quarters of the city around it.
7 matches, including a semifinal. In the Texas heat parking lots don't have AC, they are heat radiators, absorbing heat during the day and liberating it slowly.
Arrowhead sits on 26 hectares of asphalt, it is one of the largest parking footprints in the NFL. The 400 meters walk in the parking lot will be done across surfaces that have been absorbing sun since dawn.
Atlanta has the smallest thermal gap of all 16 host cities. Even its hottest hexagons have an NDVI of 0.31, greener than most cities' coolest spots. Mercedes-Benz Stadium has a retractable roof, and the city around it has a tree canopy that does what engineered surfaces cannot.
The coolest stadium in the tournament. Eight matches, including the final. With a temperature of 28.2°C at the surface it is cooler than 98% of the metro area.
But New York's risk is not heat. It is humidity. A wet-bulb temperature above 26°C is more dangerous than dry heat at 35°C. The body stops cooling itself as sweat no longer evaporates. July in the New York metro averages 24°C wet-bulb. A warm spike during the final could push it past the threshold.
In every city we mapped, the parking infrastructure around the venue is hotter than the surrounding neighborhood. The players will get cooling breaks, but the impact of the infrastructure is felt beyond the match.
Not every stadium demands a walk in a parking lot. Mercedes-Benz in Atlanta sits next to a MARTA rail station. MetLife is reachable by NJ Transit from Penn Station. BC Place and BMO Field have rail stops adjacent. For those venues, the heat island exists but fewer fans cross it.
The worst exposure falls on the car-dependent stadiums like Arrowhead, NRG, and AT&T, where the parking lot is the only way in. Cities that built transit access reduced the heat exposure for their fans.
66 satellite passes over Guadalajara, January 2024 through December 2025. Watch the heat island expand through the dry spring and retreat when the rainy season arrives. Kickoff at 6pm means 49,850 fans walking across a surface that has been cooking since dawn.
Surface temperature at each FIFA 2026 stadium, from Landsat.
Guadalajara is the hottest, Boston is the coolest, and the spread between them is 24.6°C.
Same color scale across all maps. Same 200-meter resolution. The patterns vary but the parking lots are consistently the hottest zones.
Click any map to enlarge.
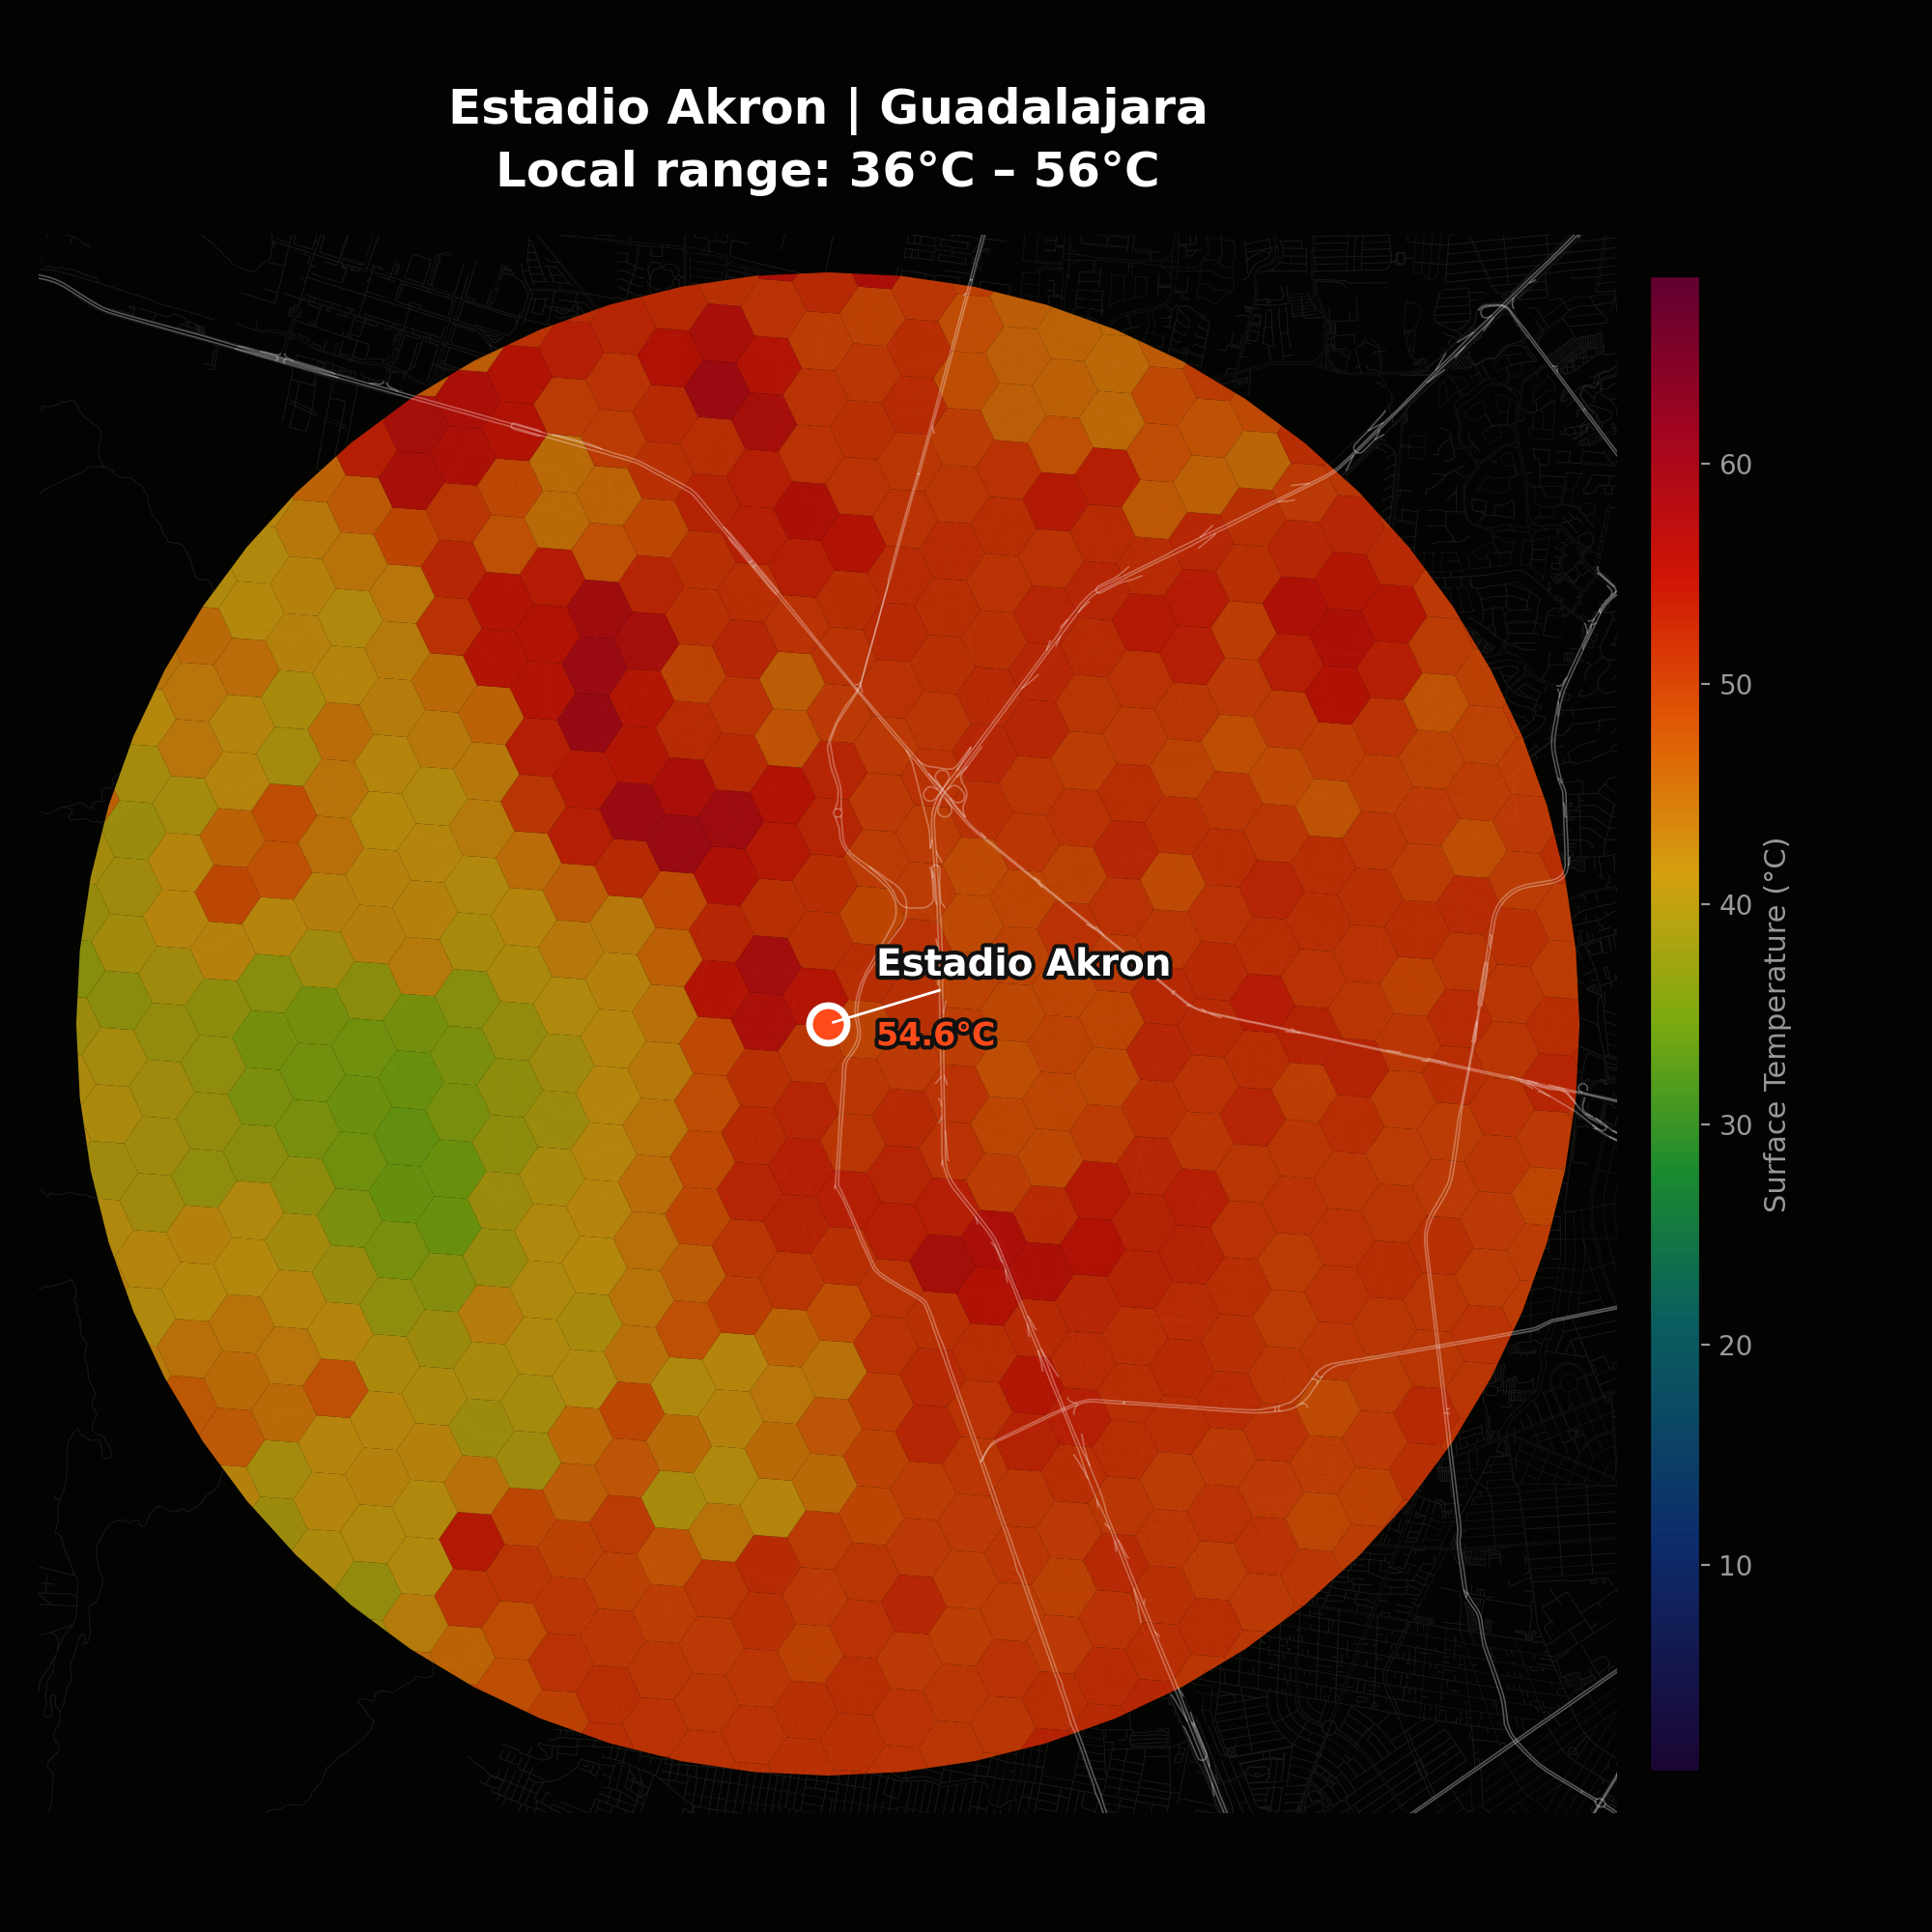 1. Guadalajara — 54.6°C
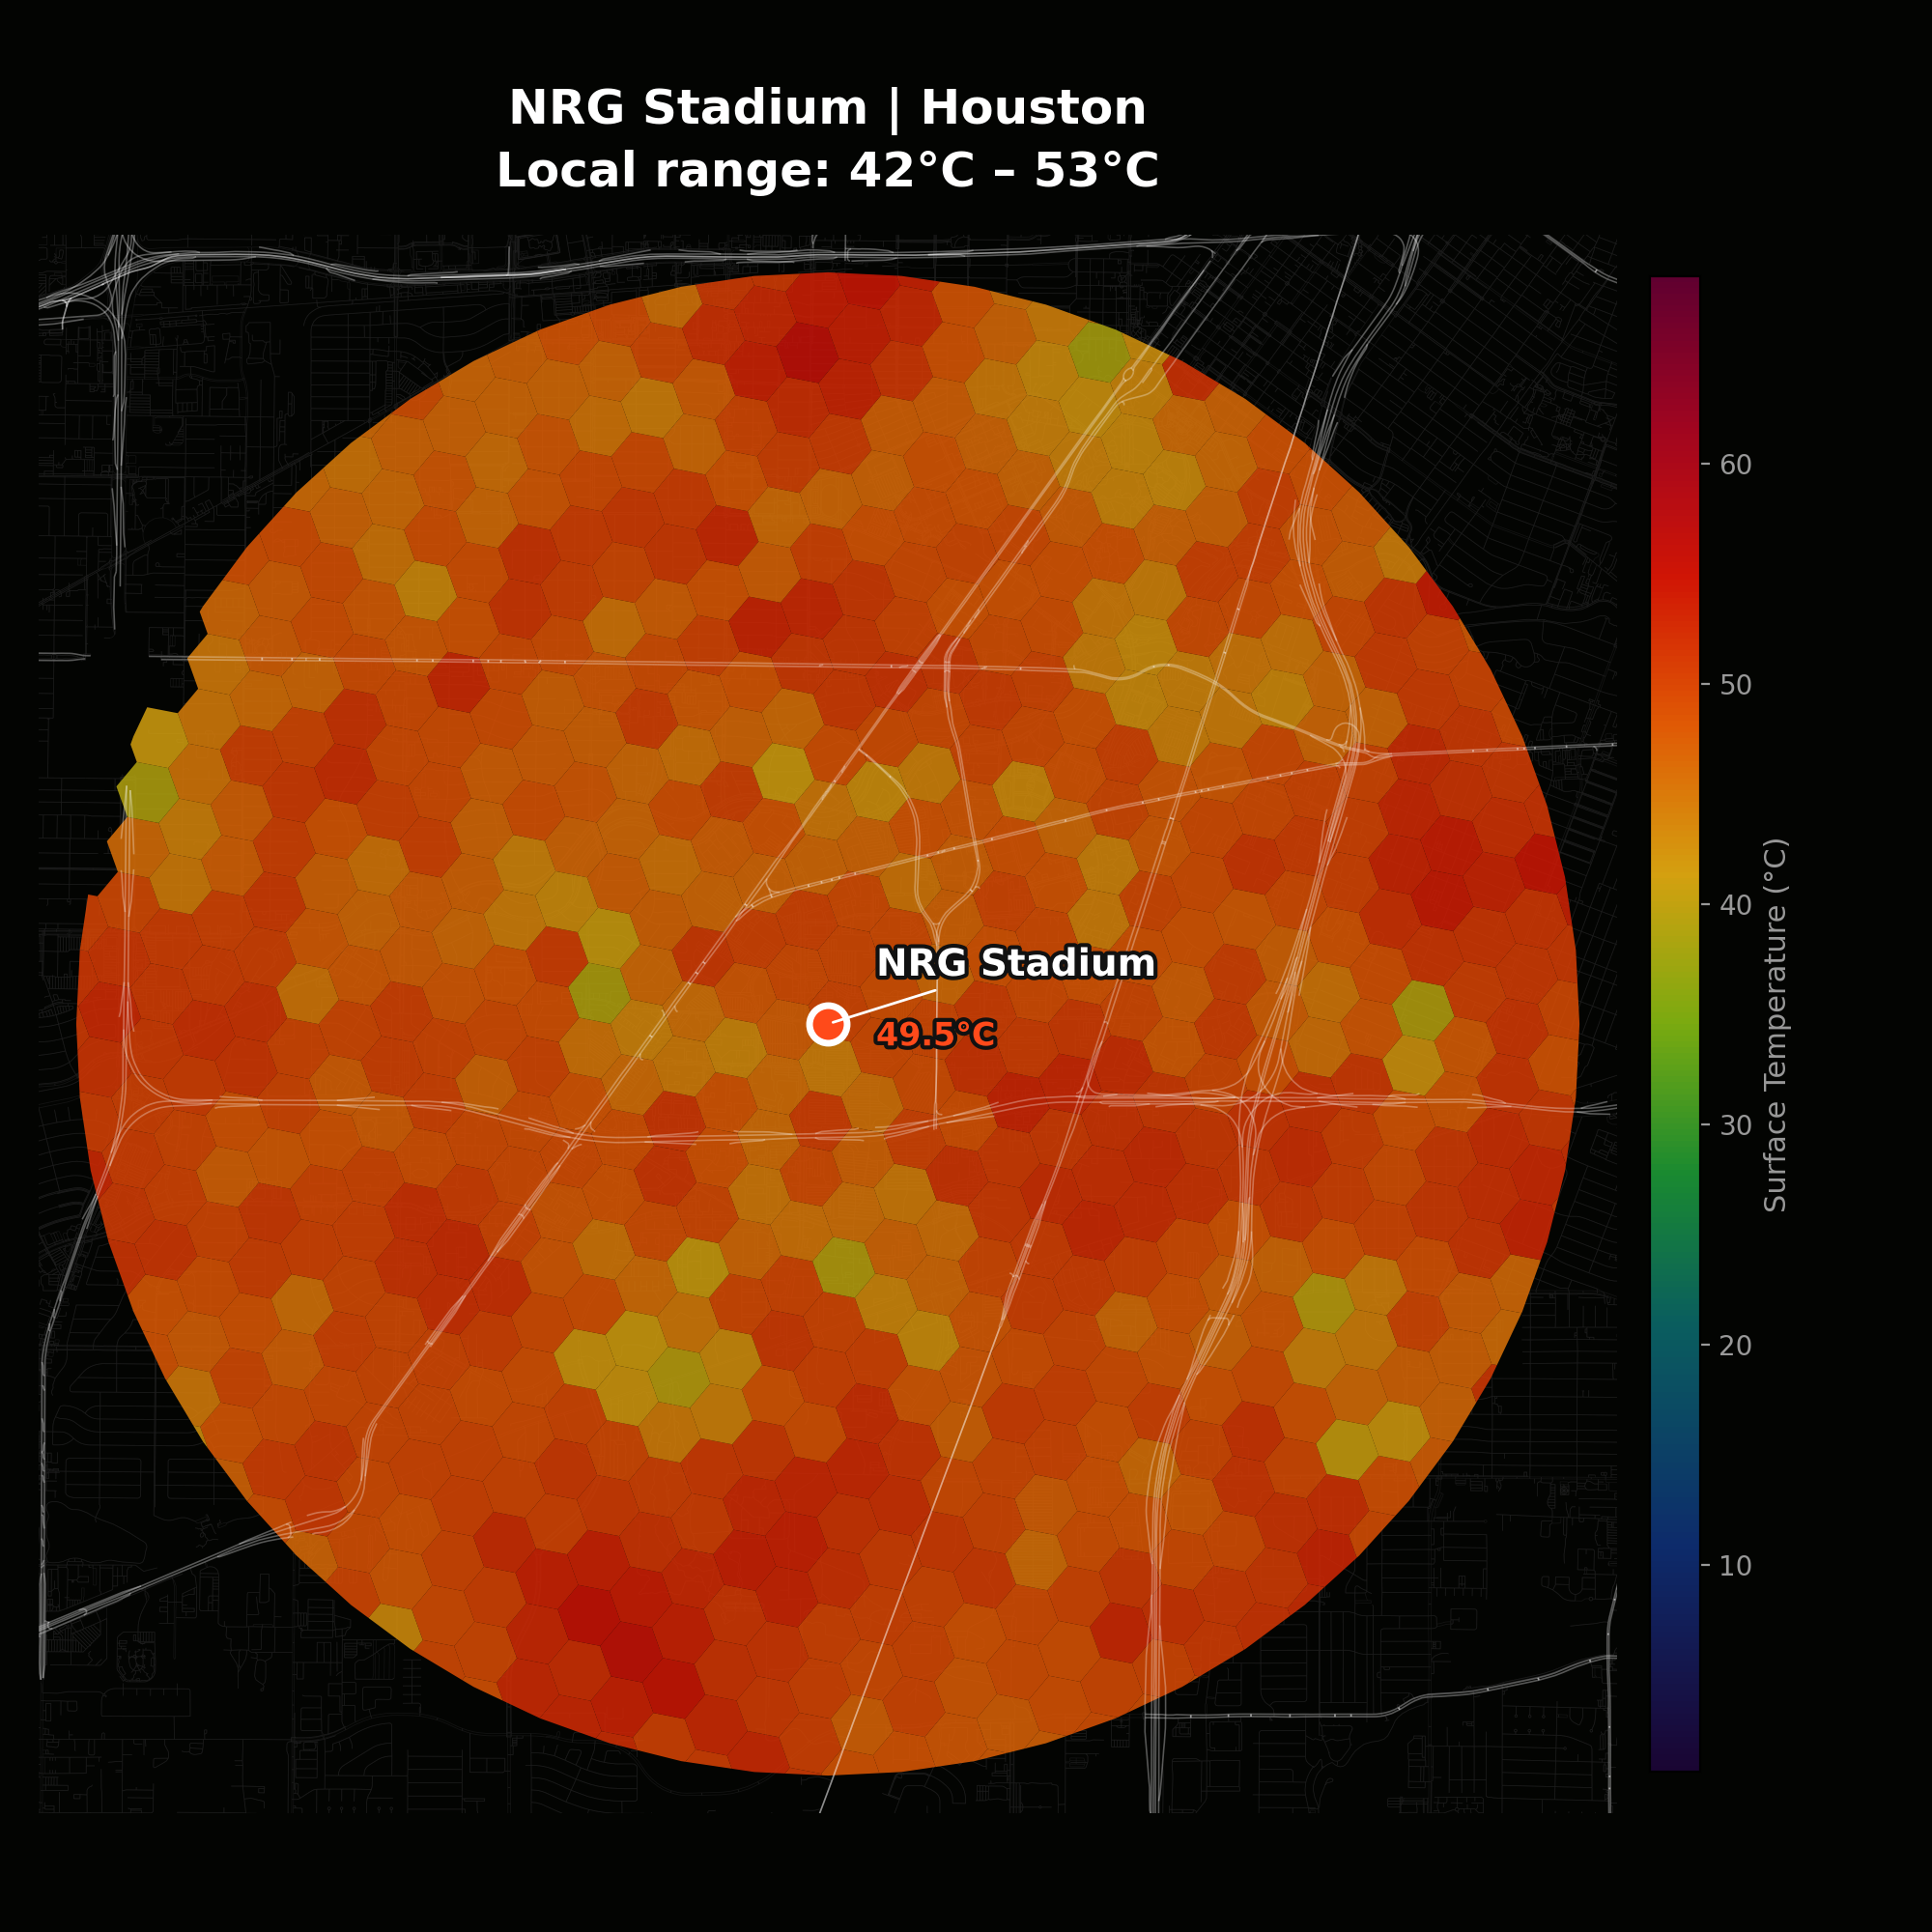 2. Houston — 49.5°C
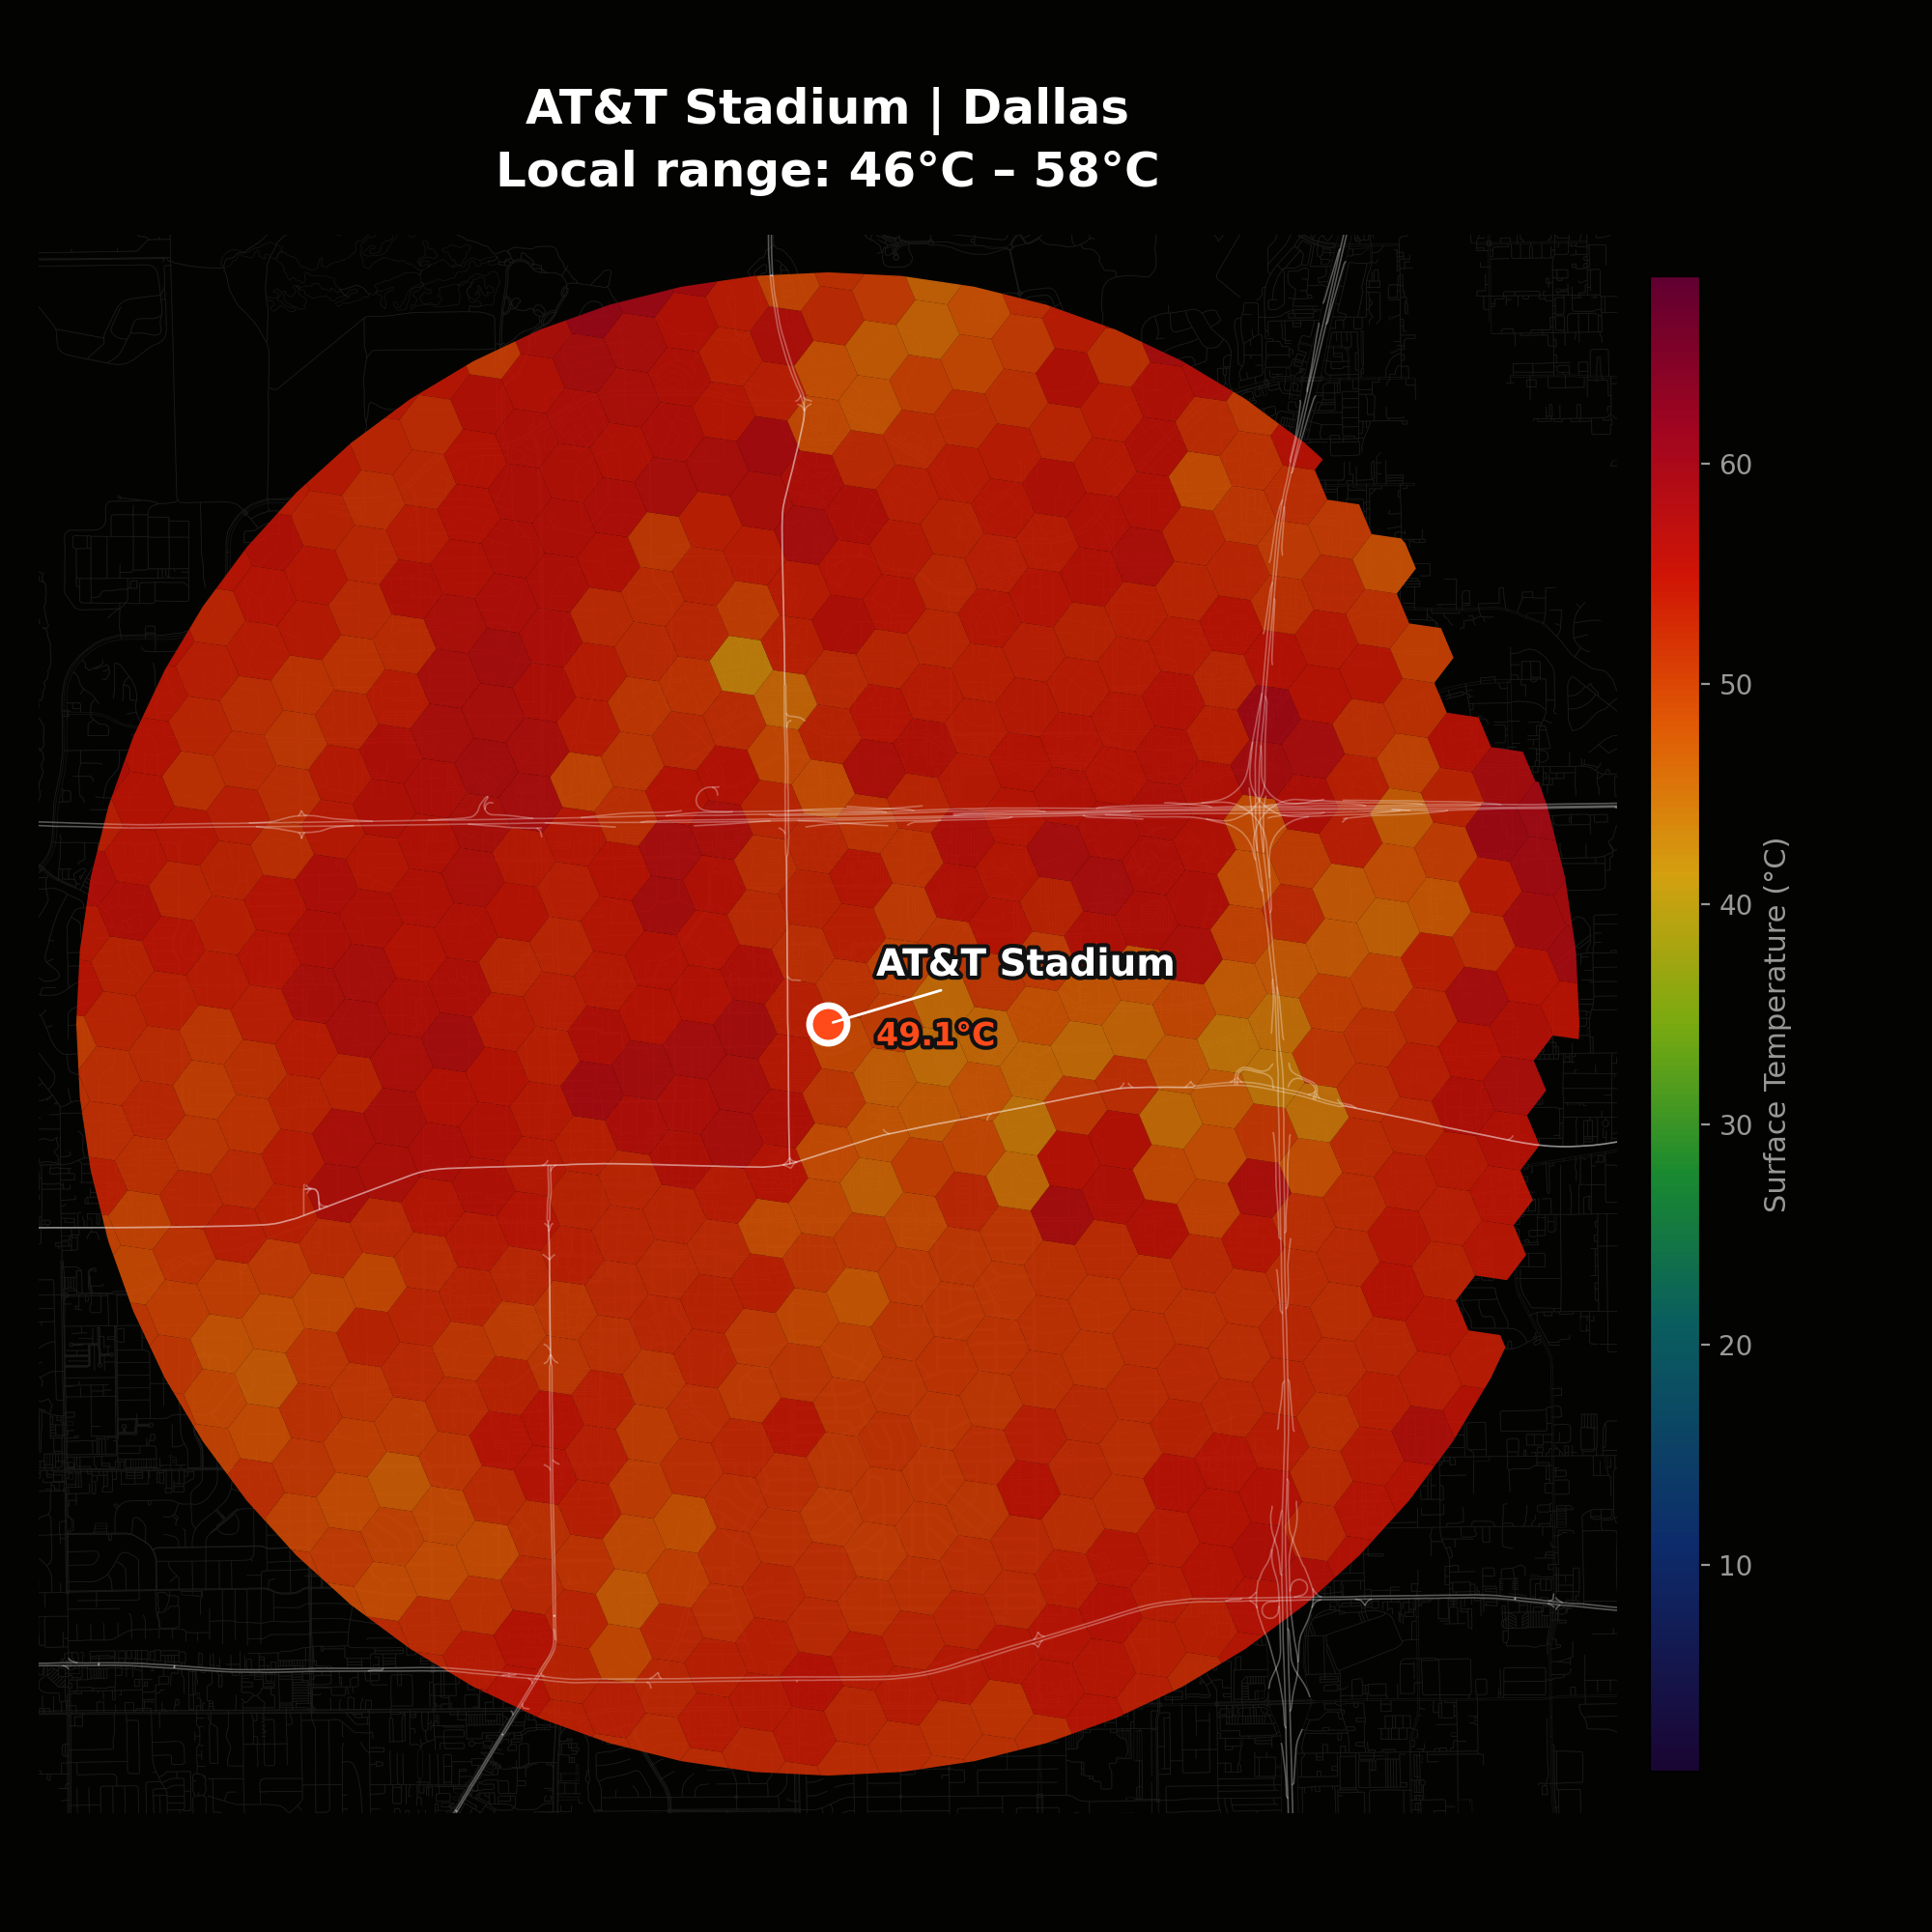 3. Dallas — 49.1°C
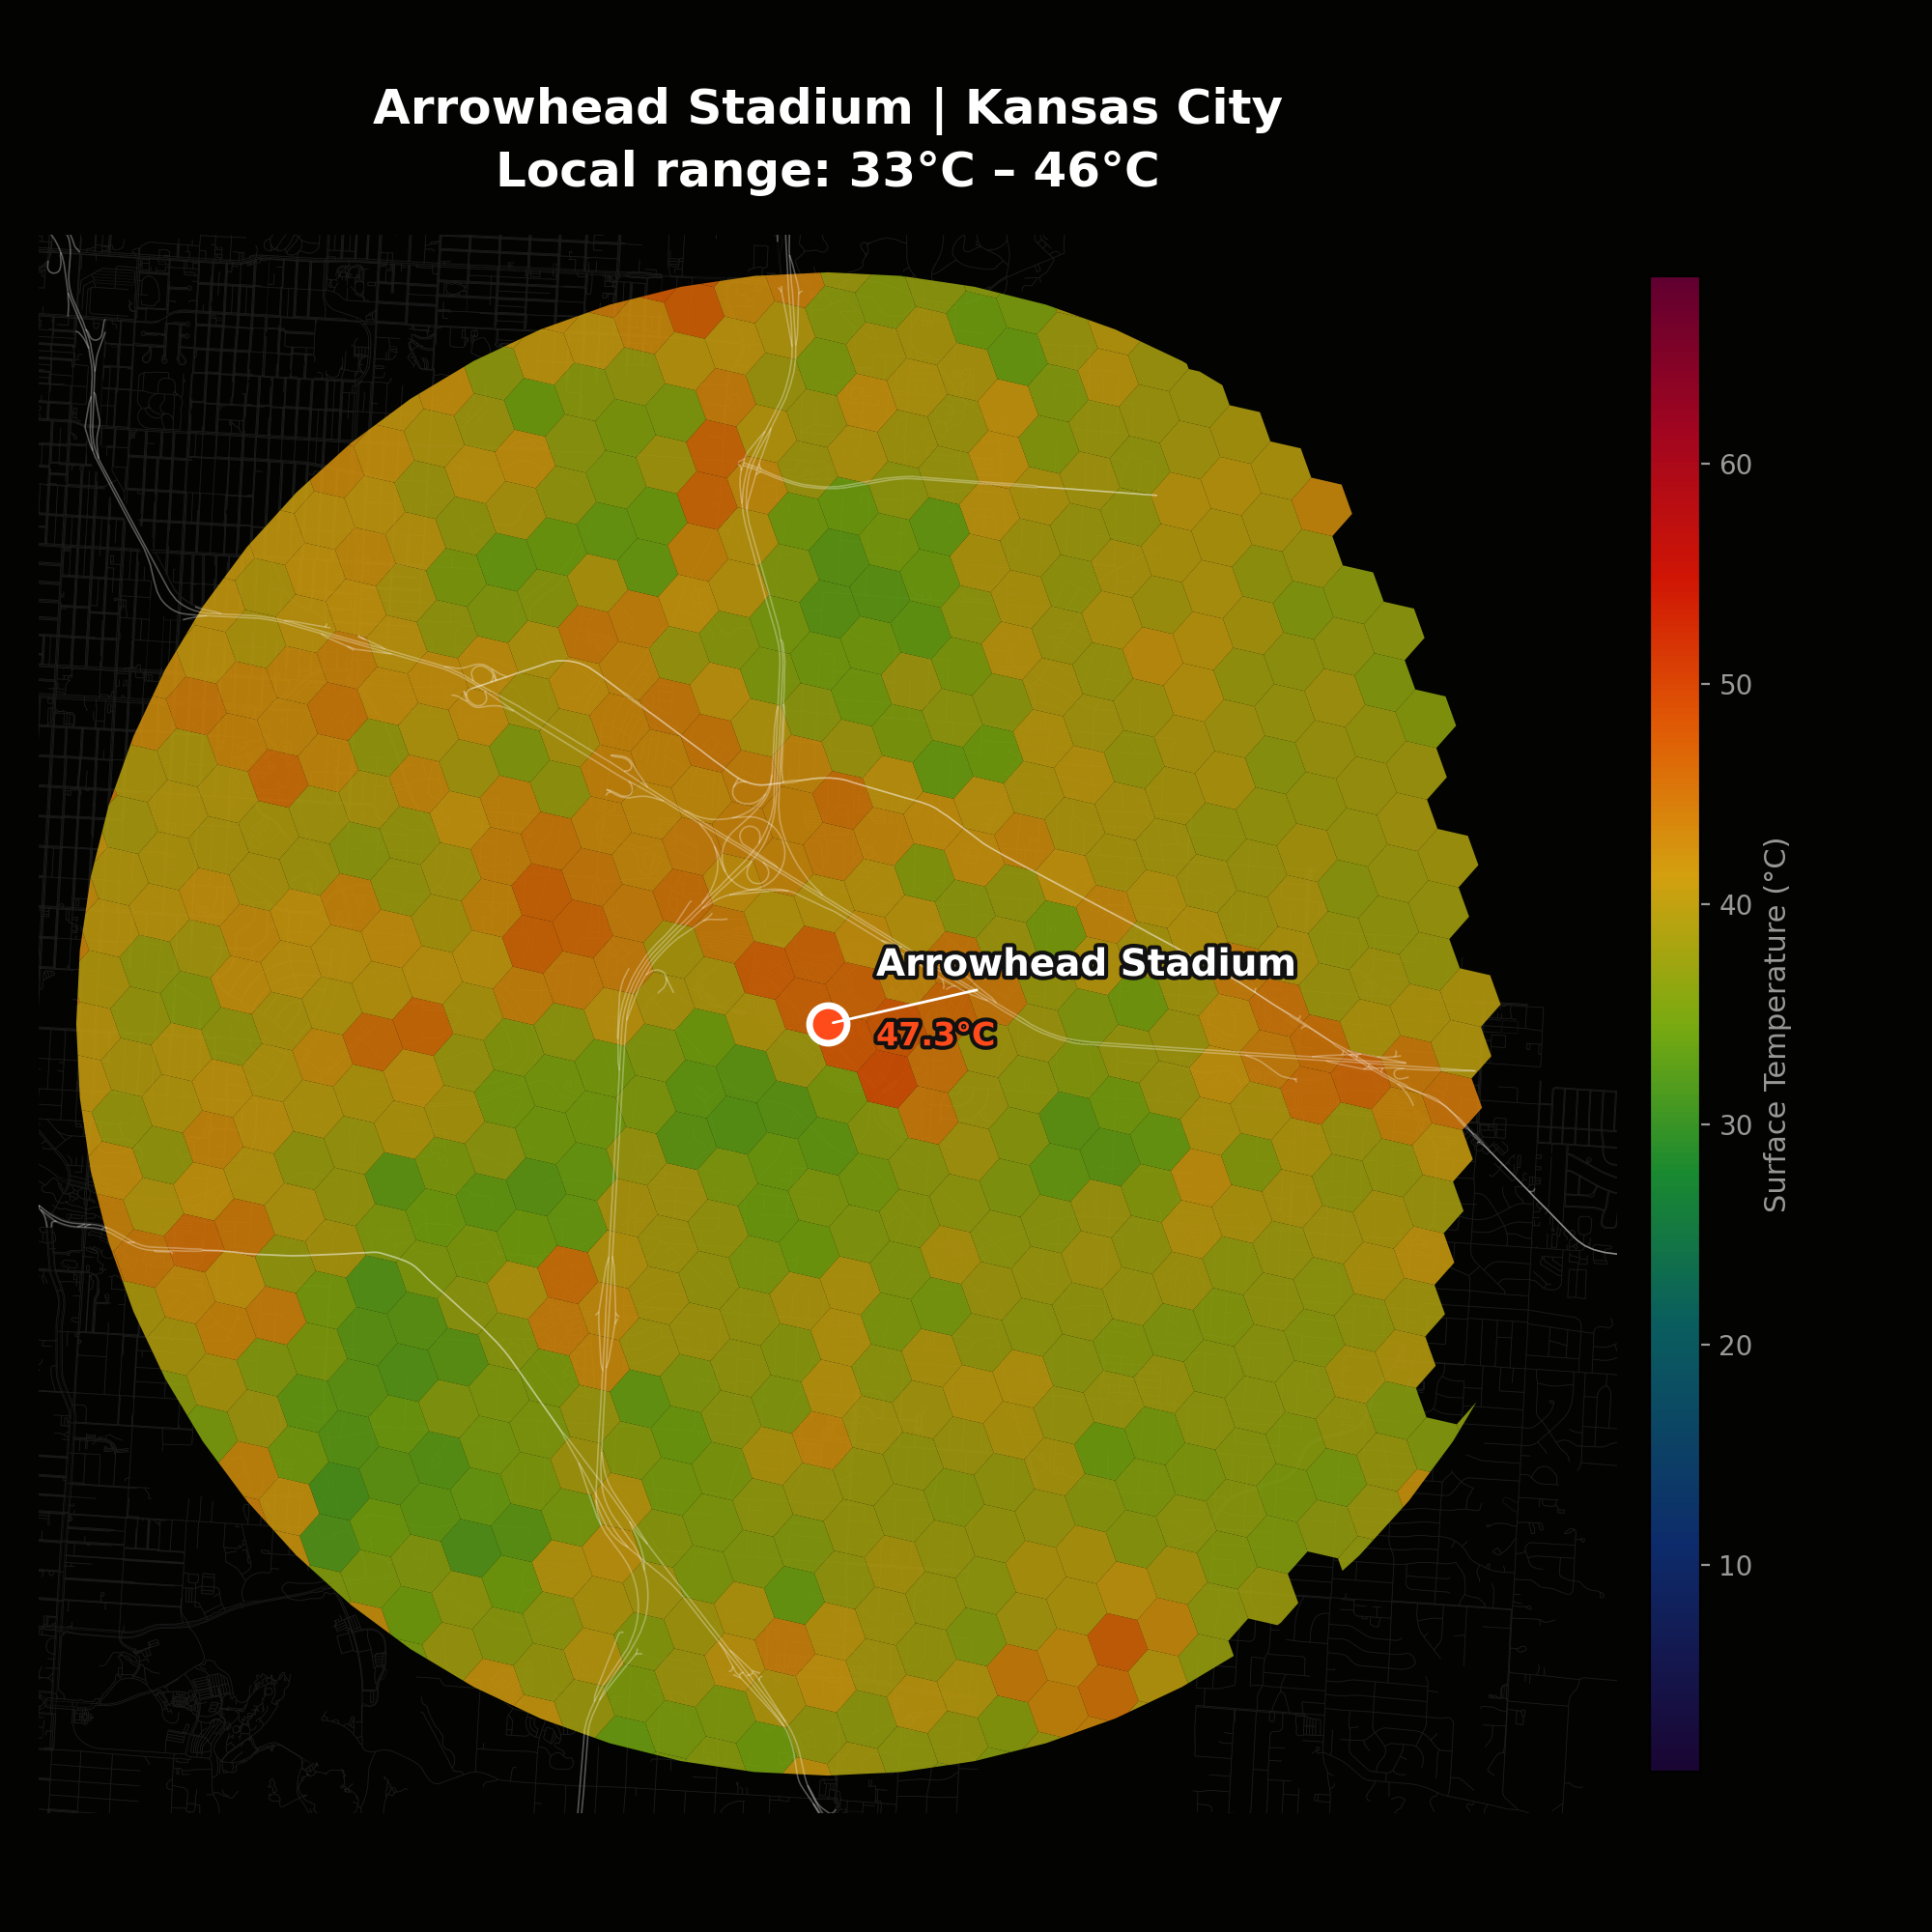 4. Kansas City — 47.3°C
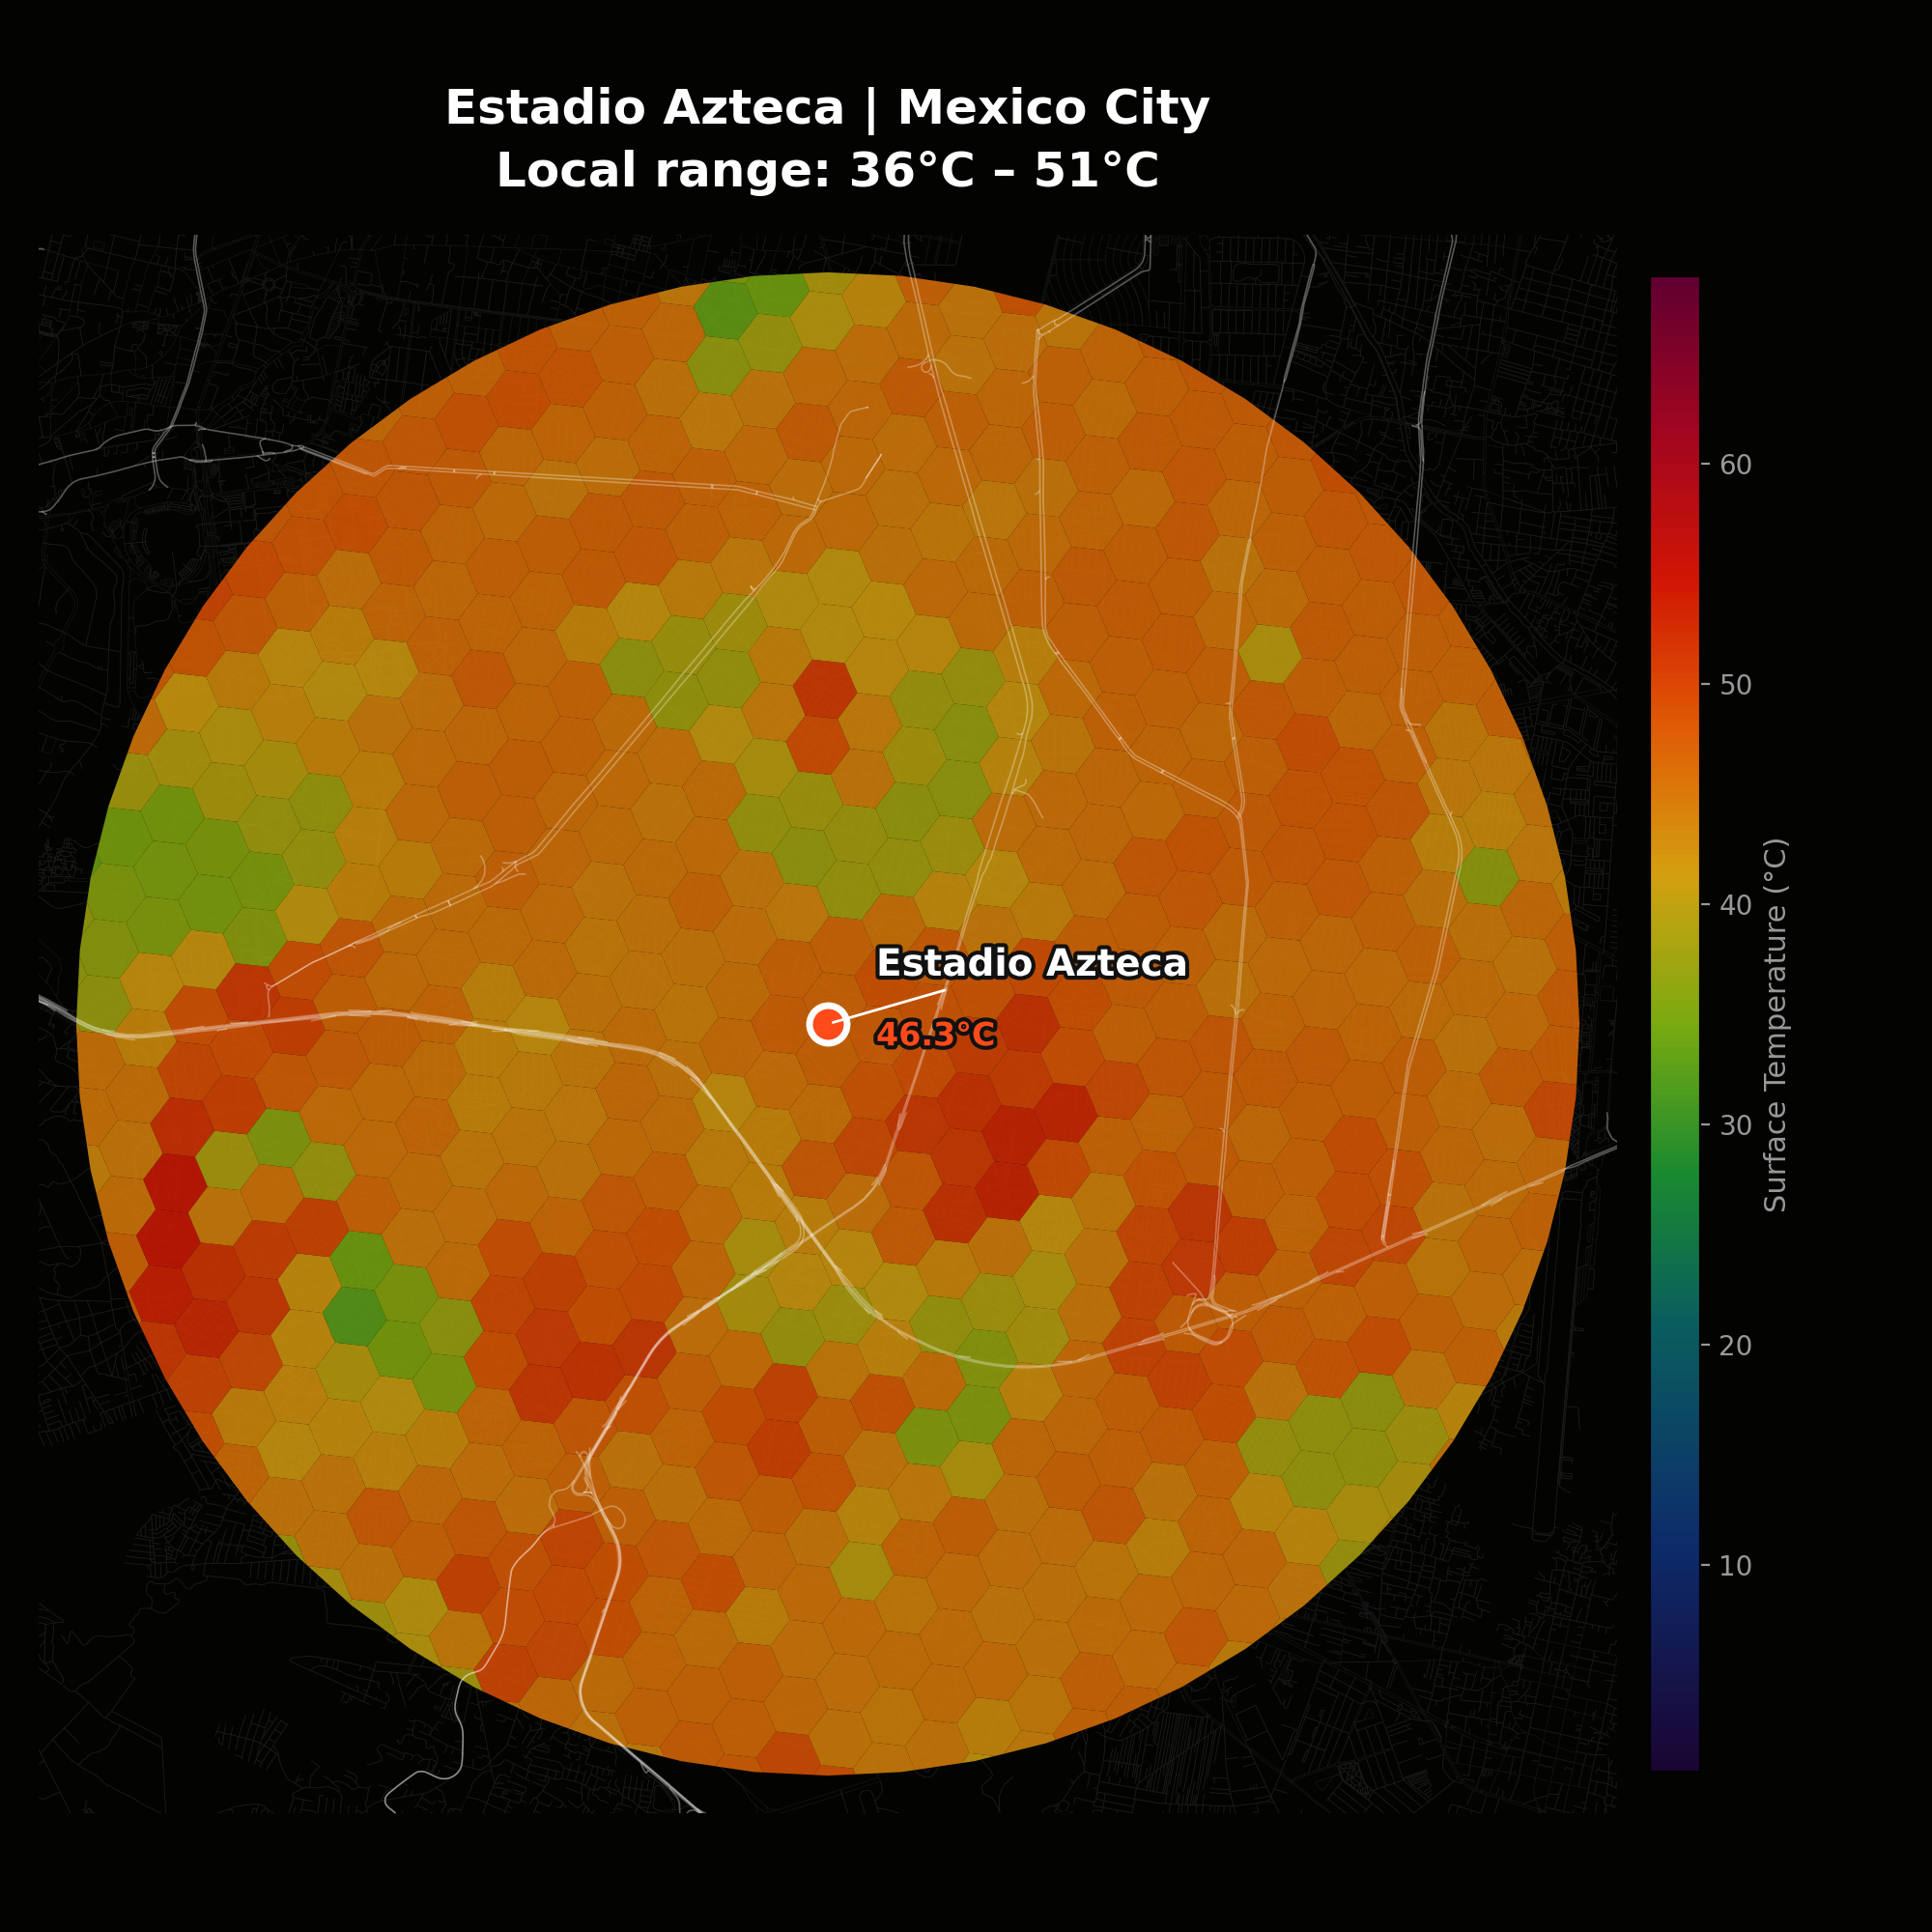 5. Mexico City — 46.3°C
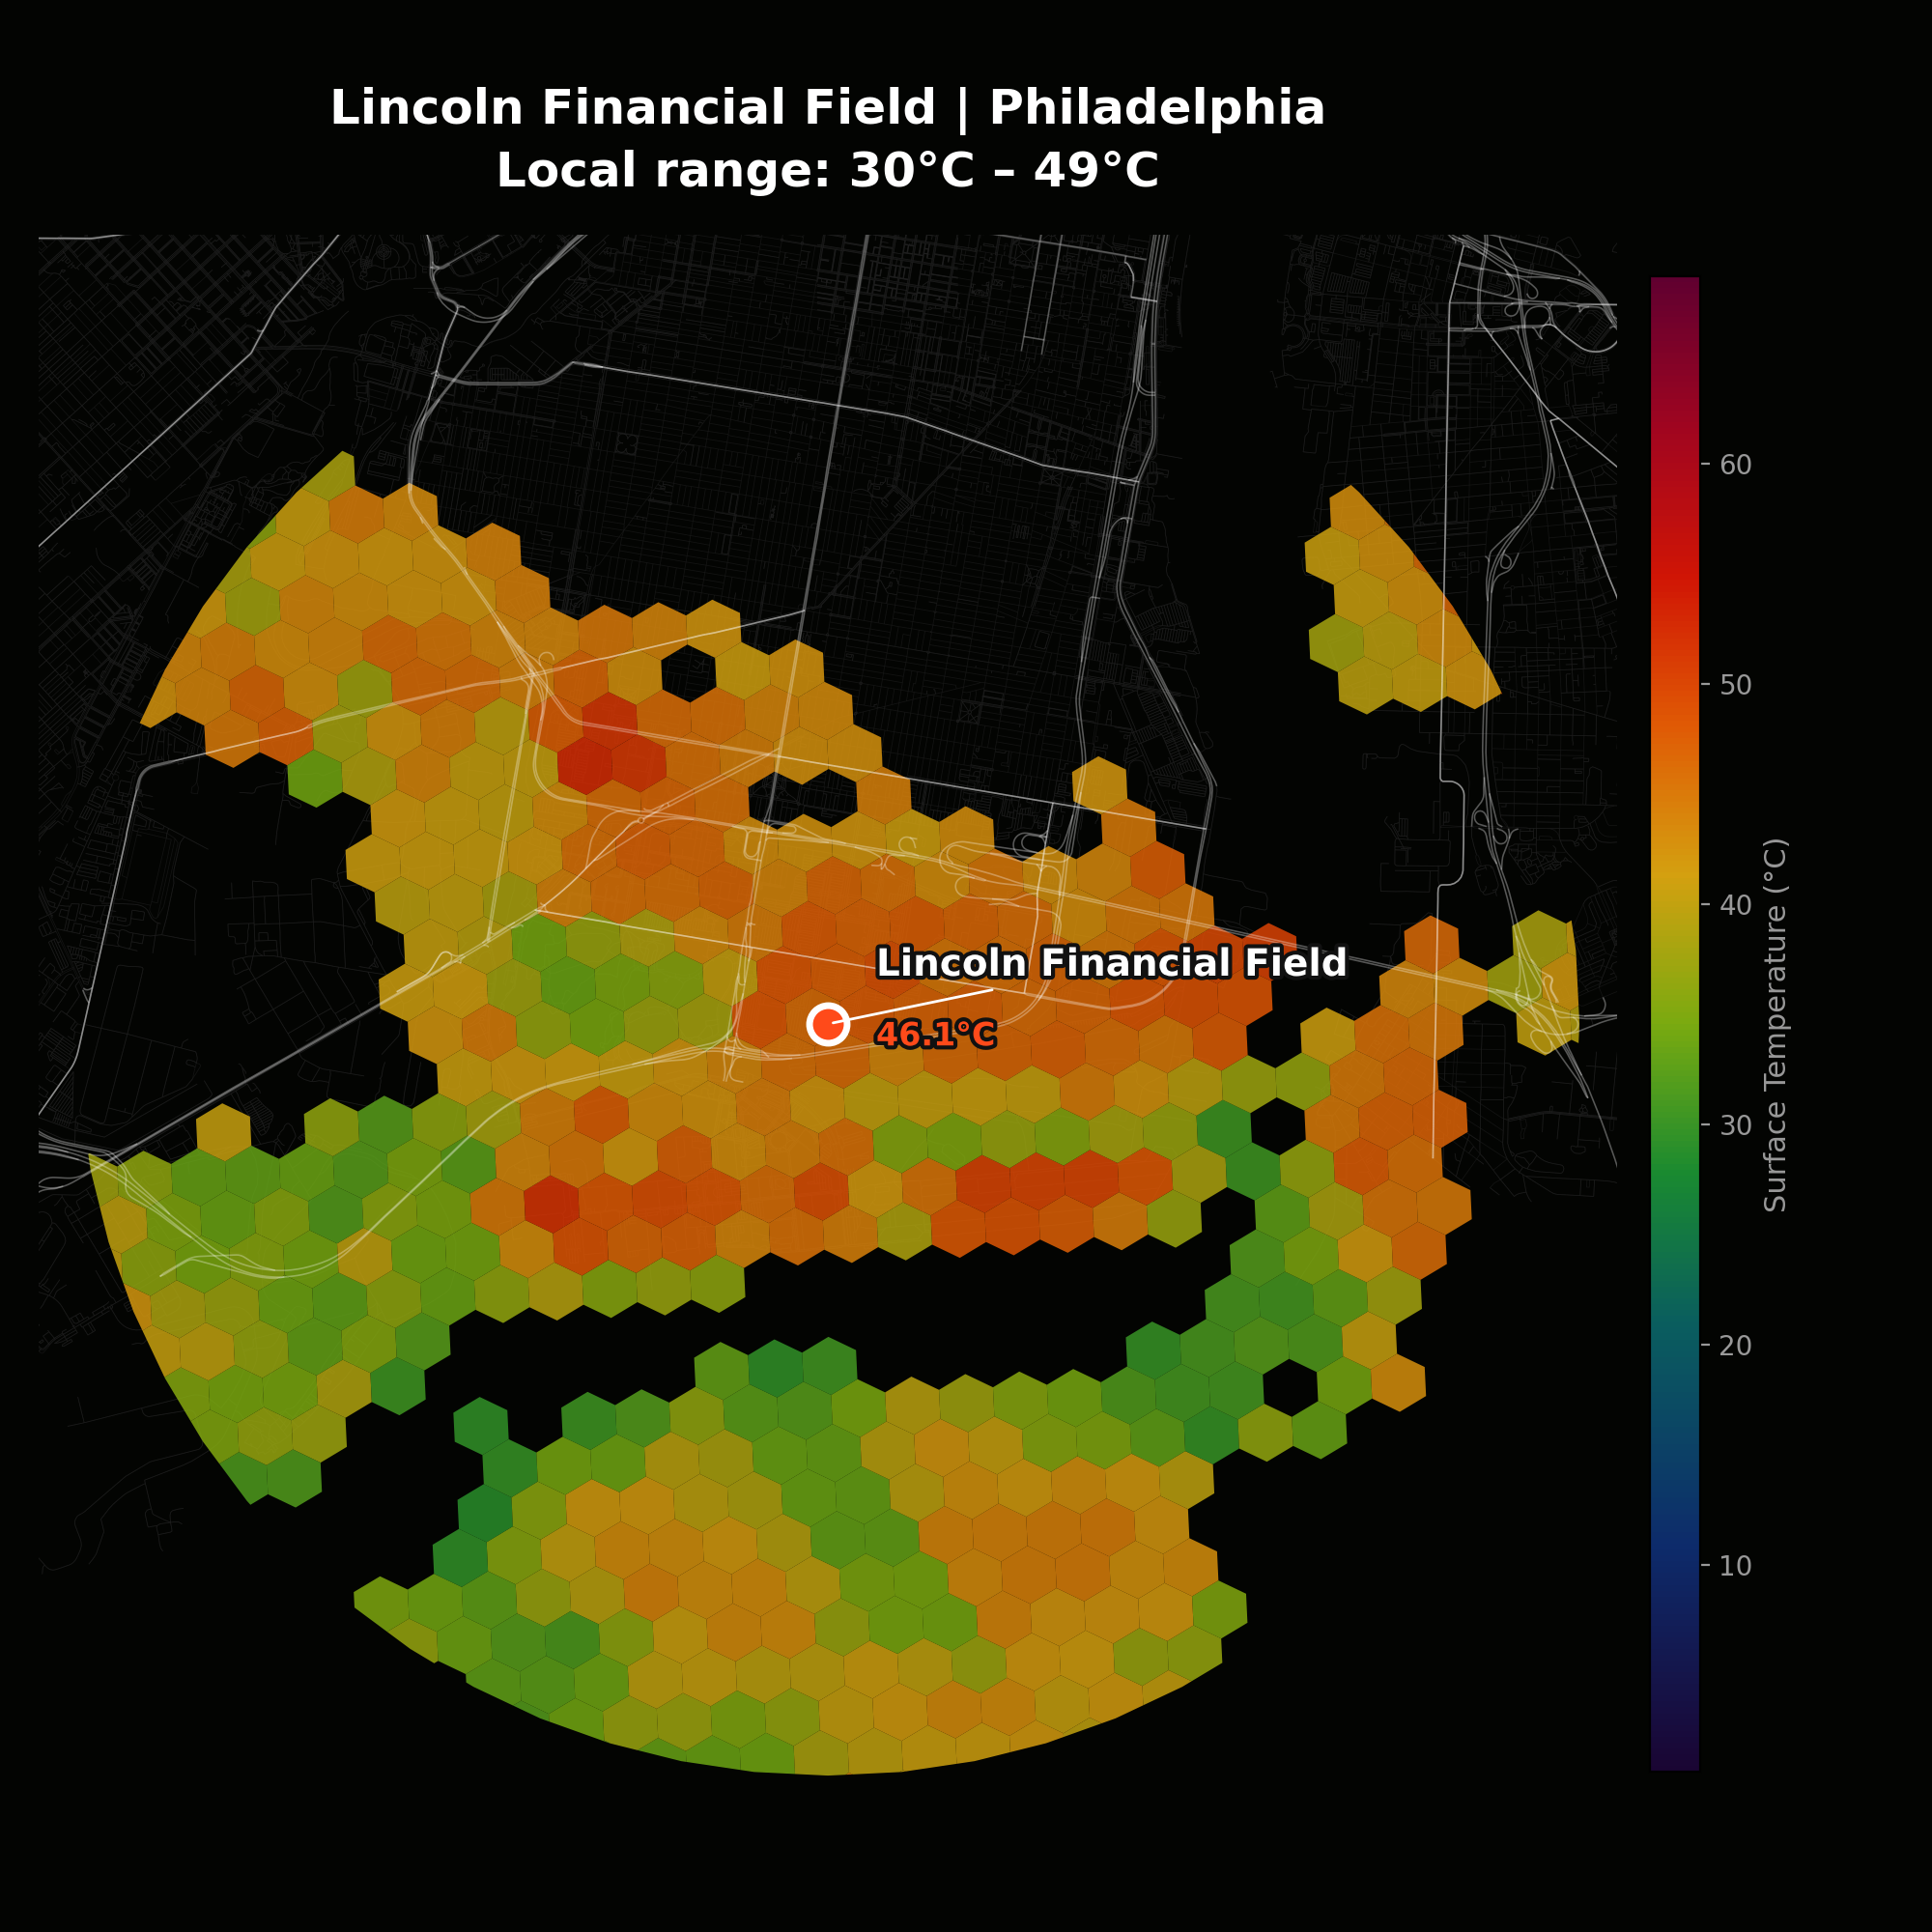 6. Philadelphia — 46.1°C
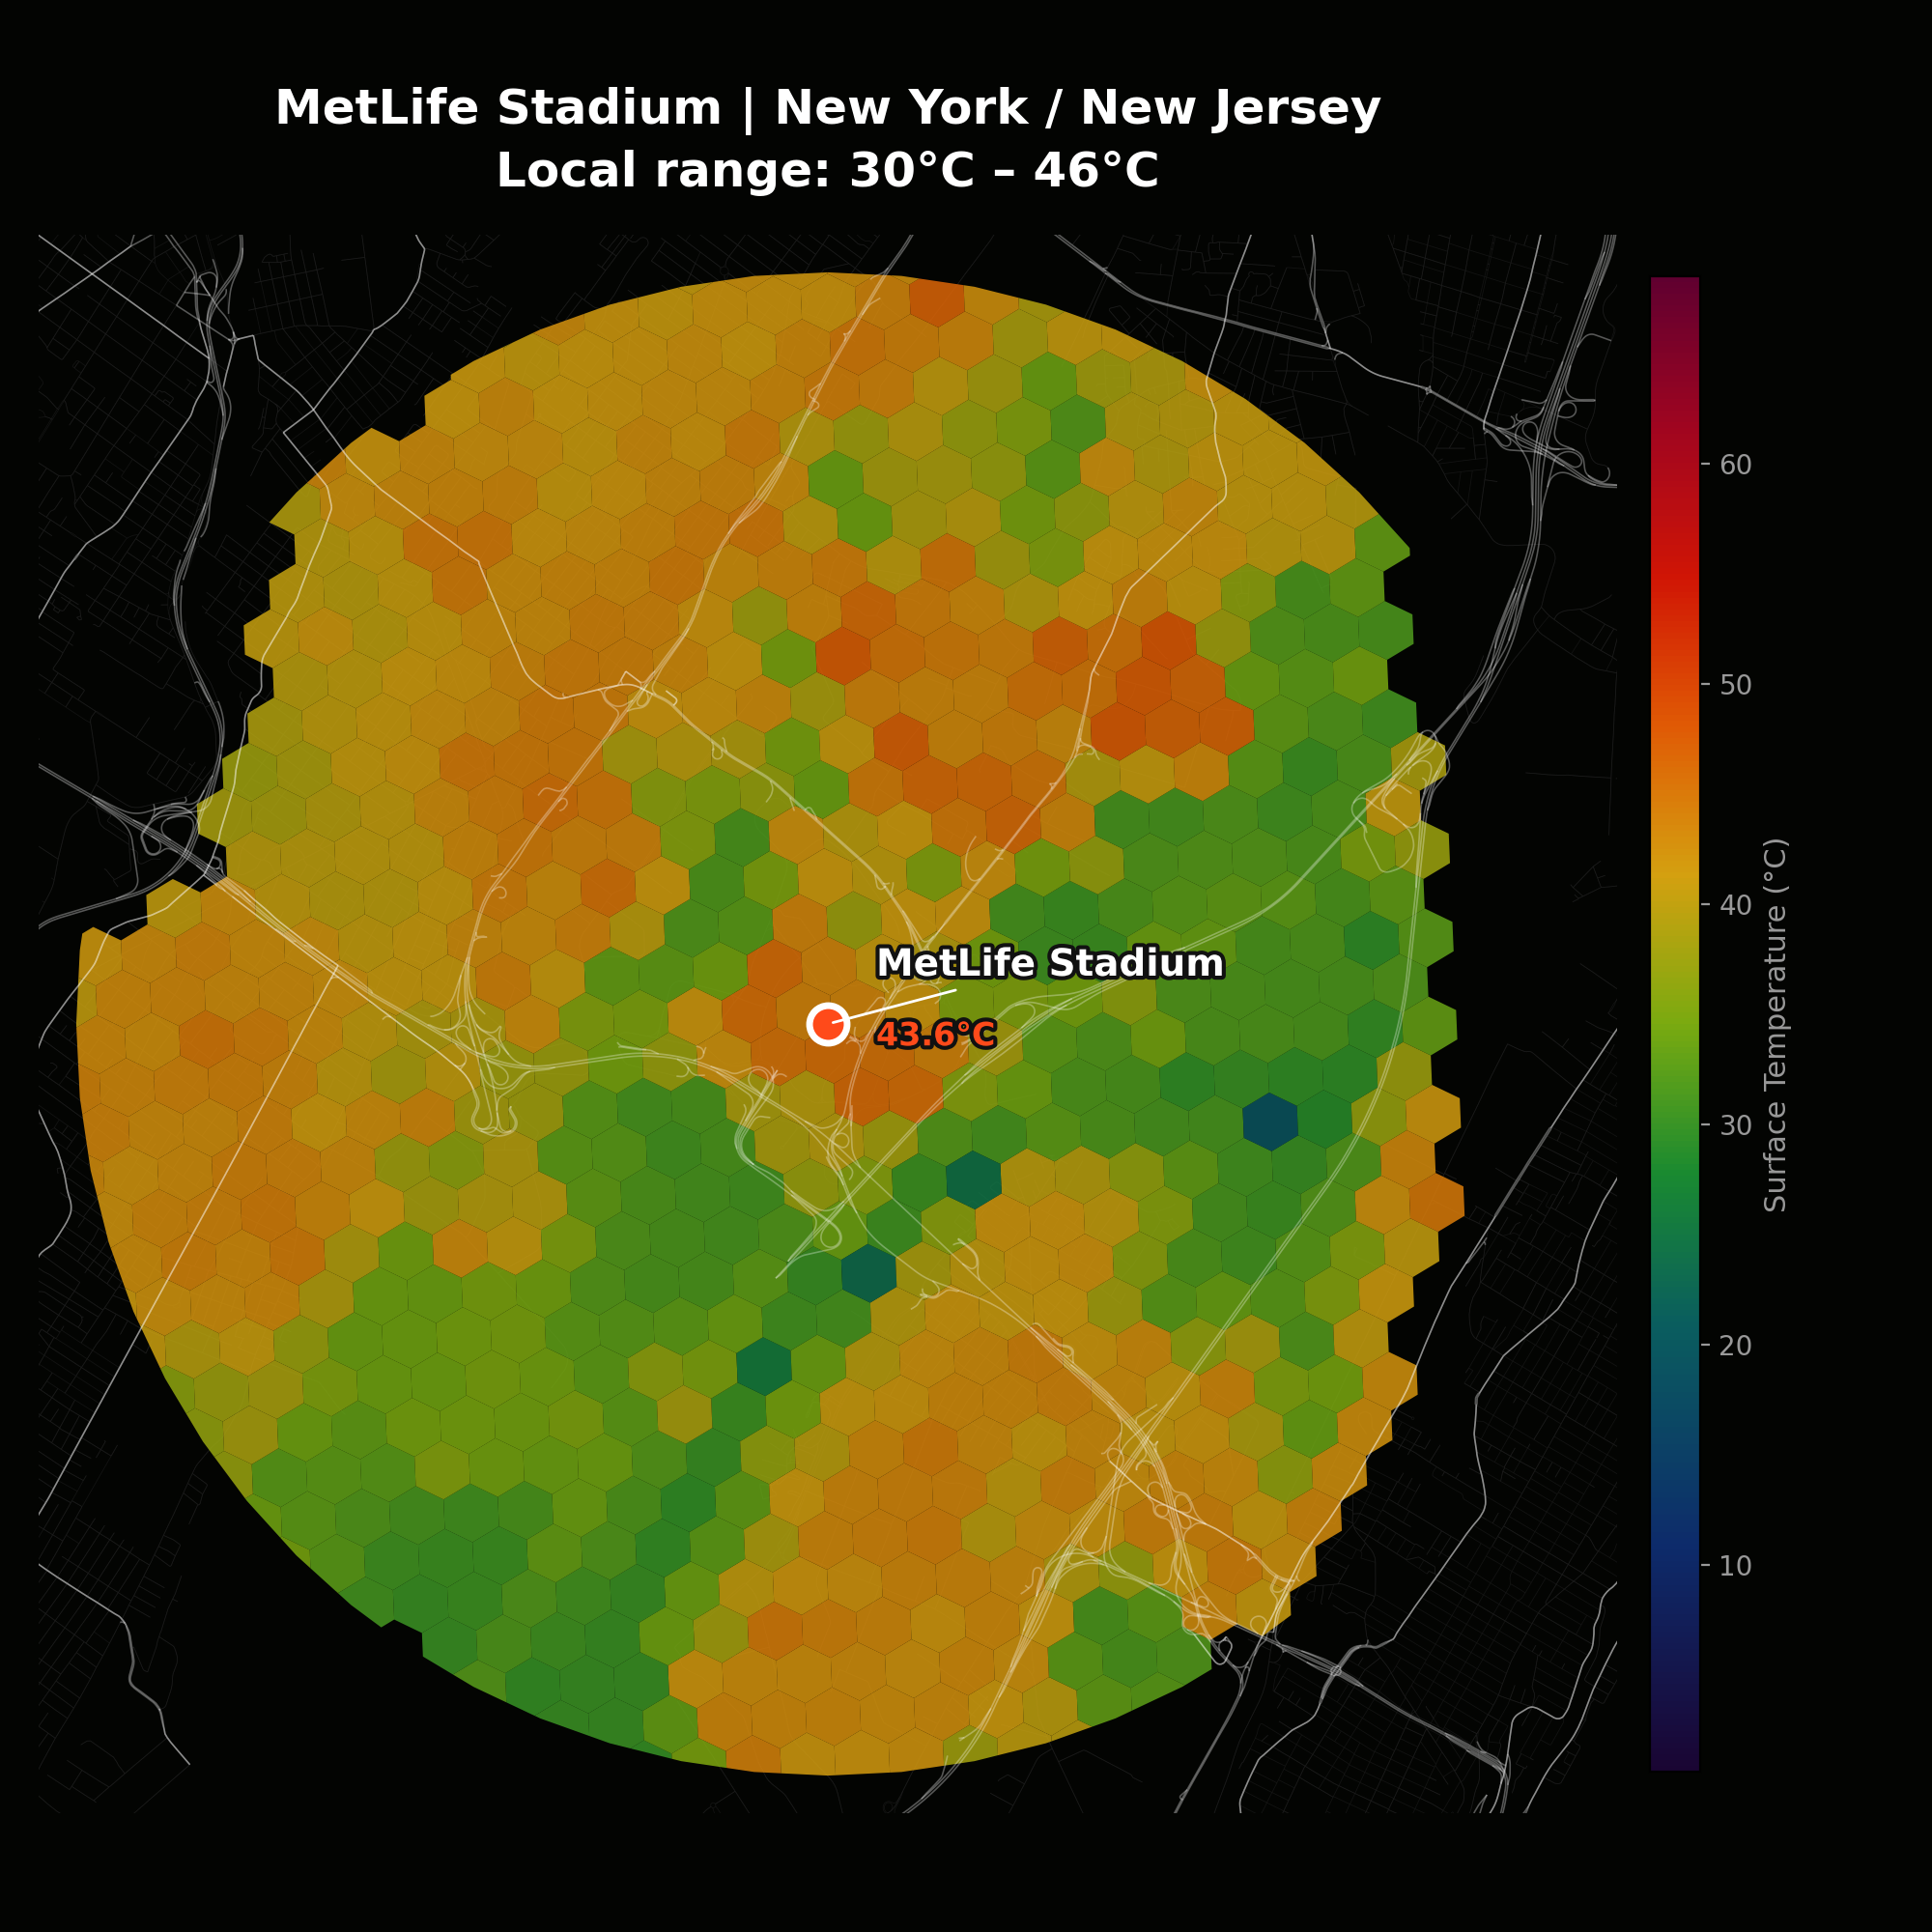 7. New York — 43.6°C
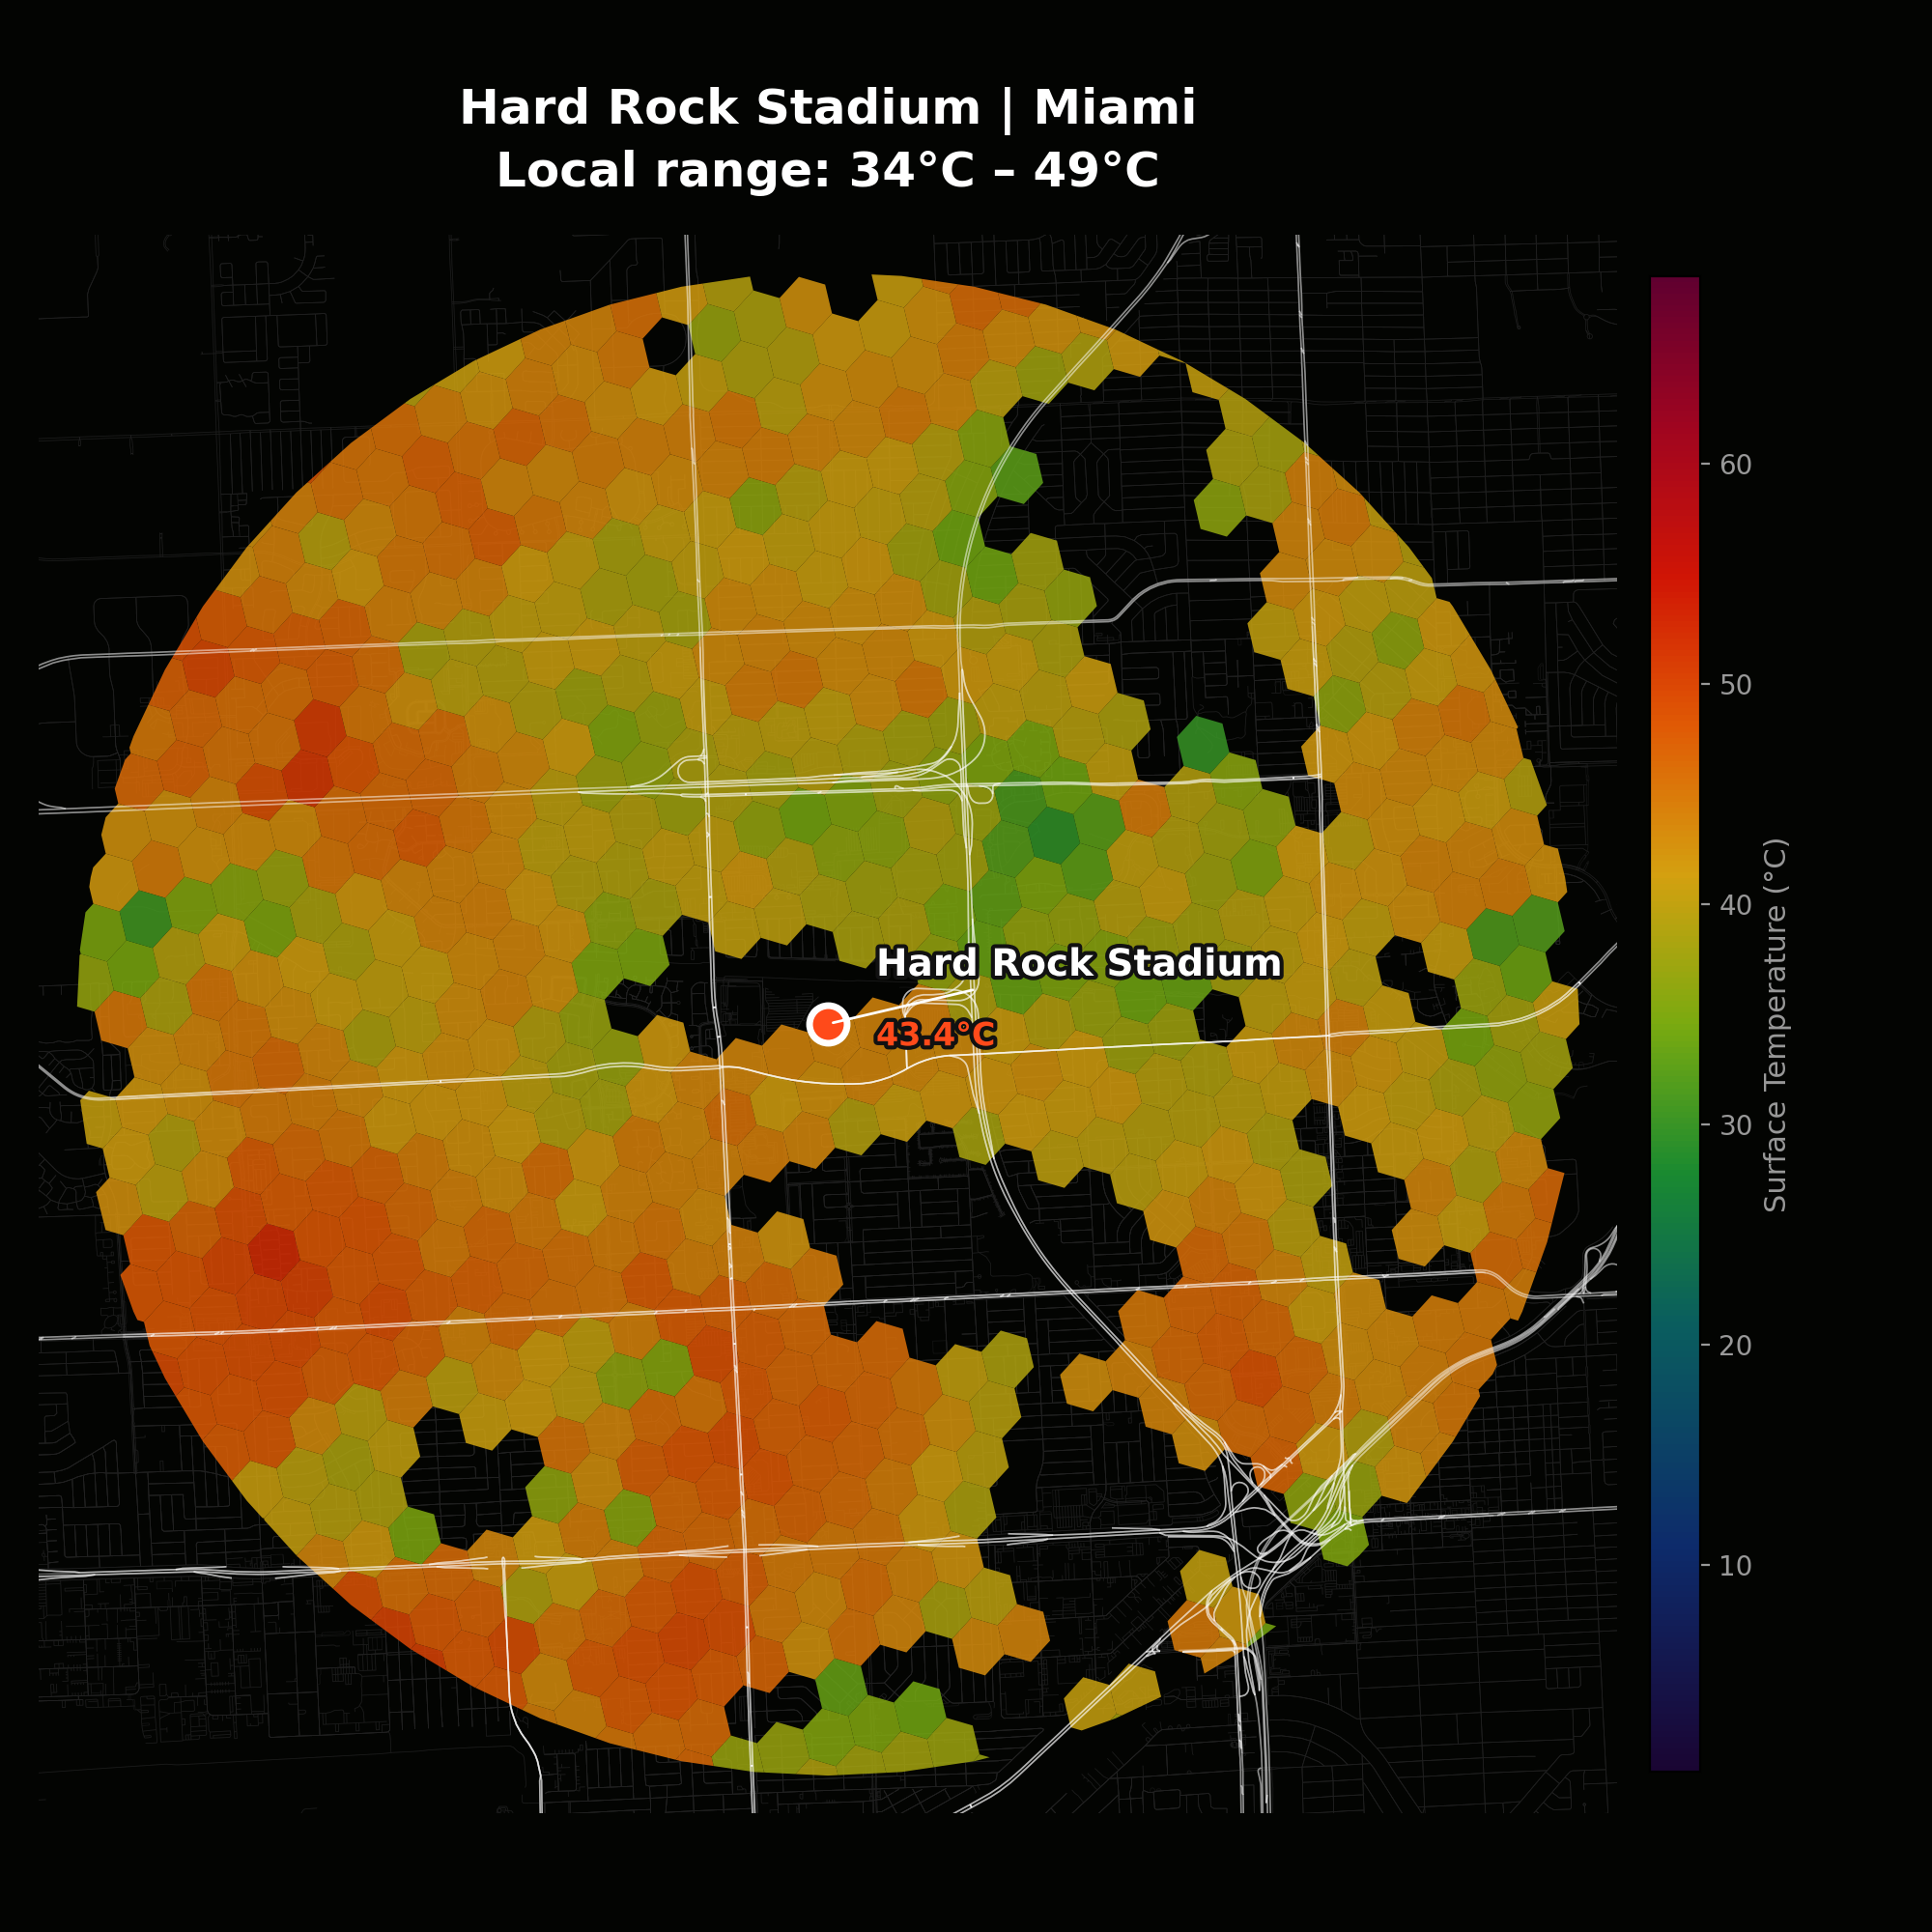 8. Miami — 43.4°C
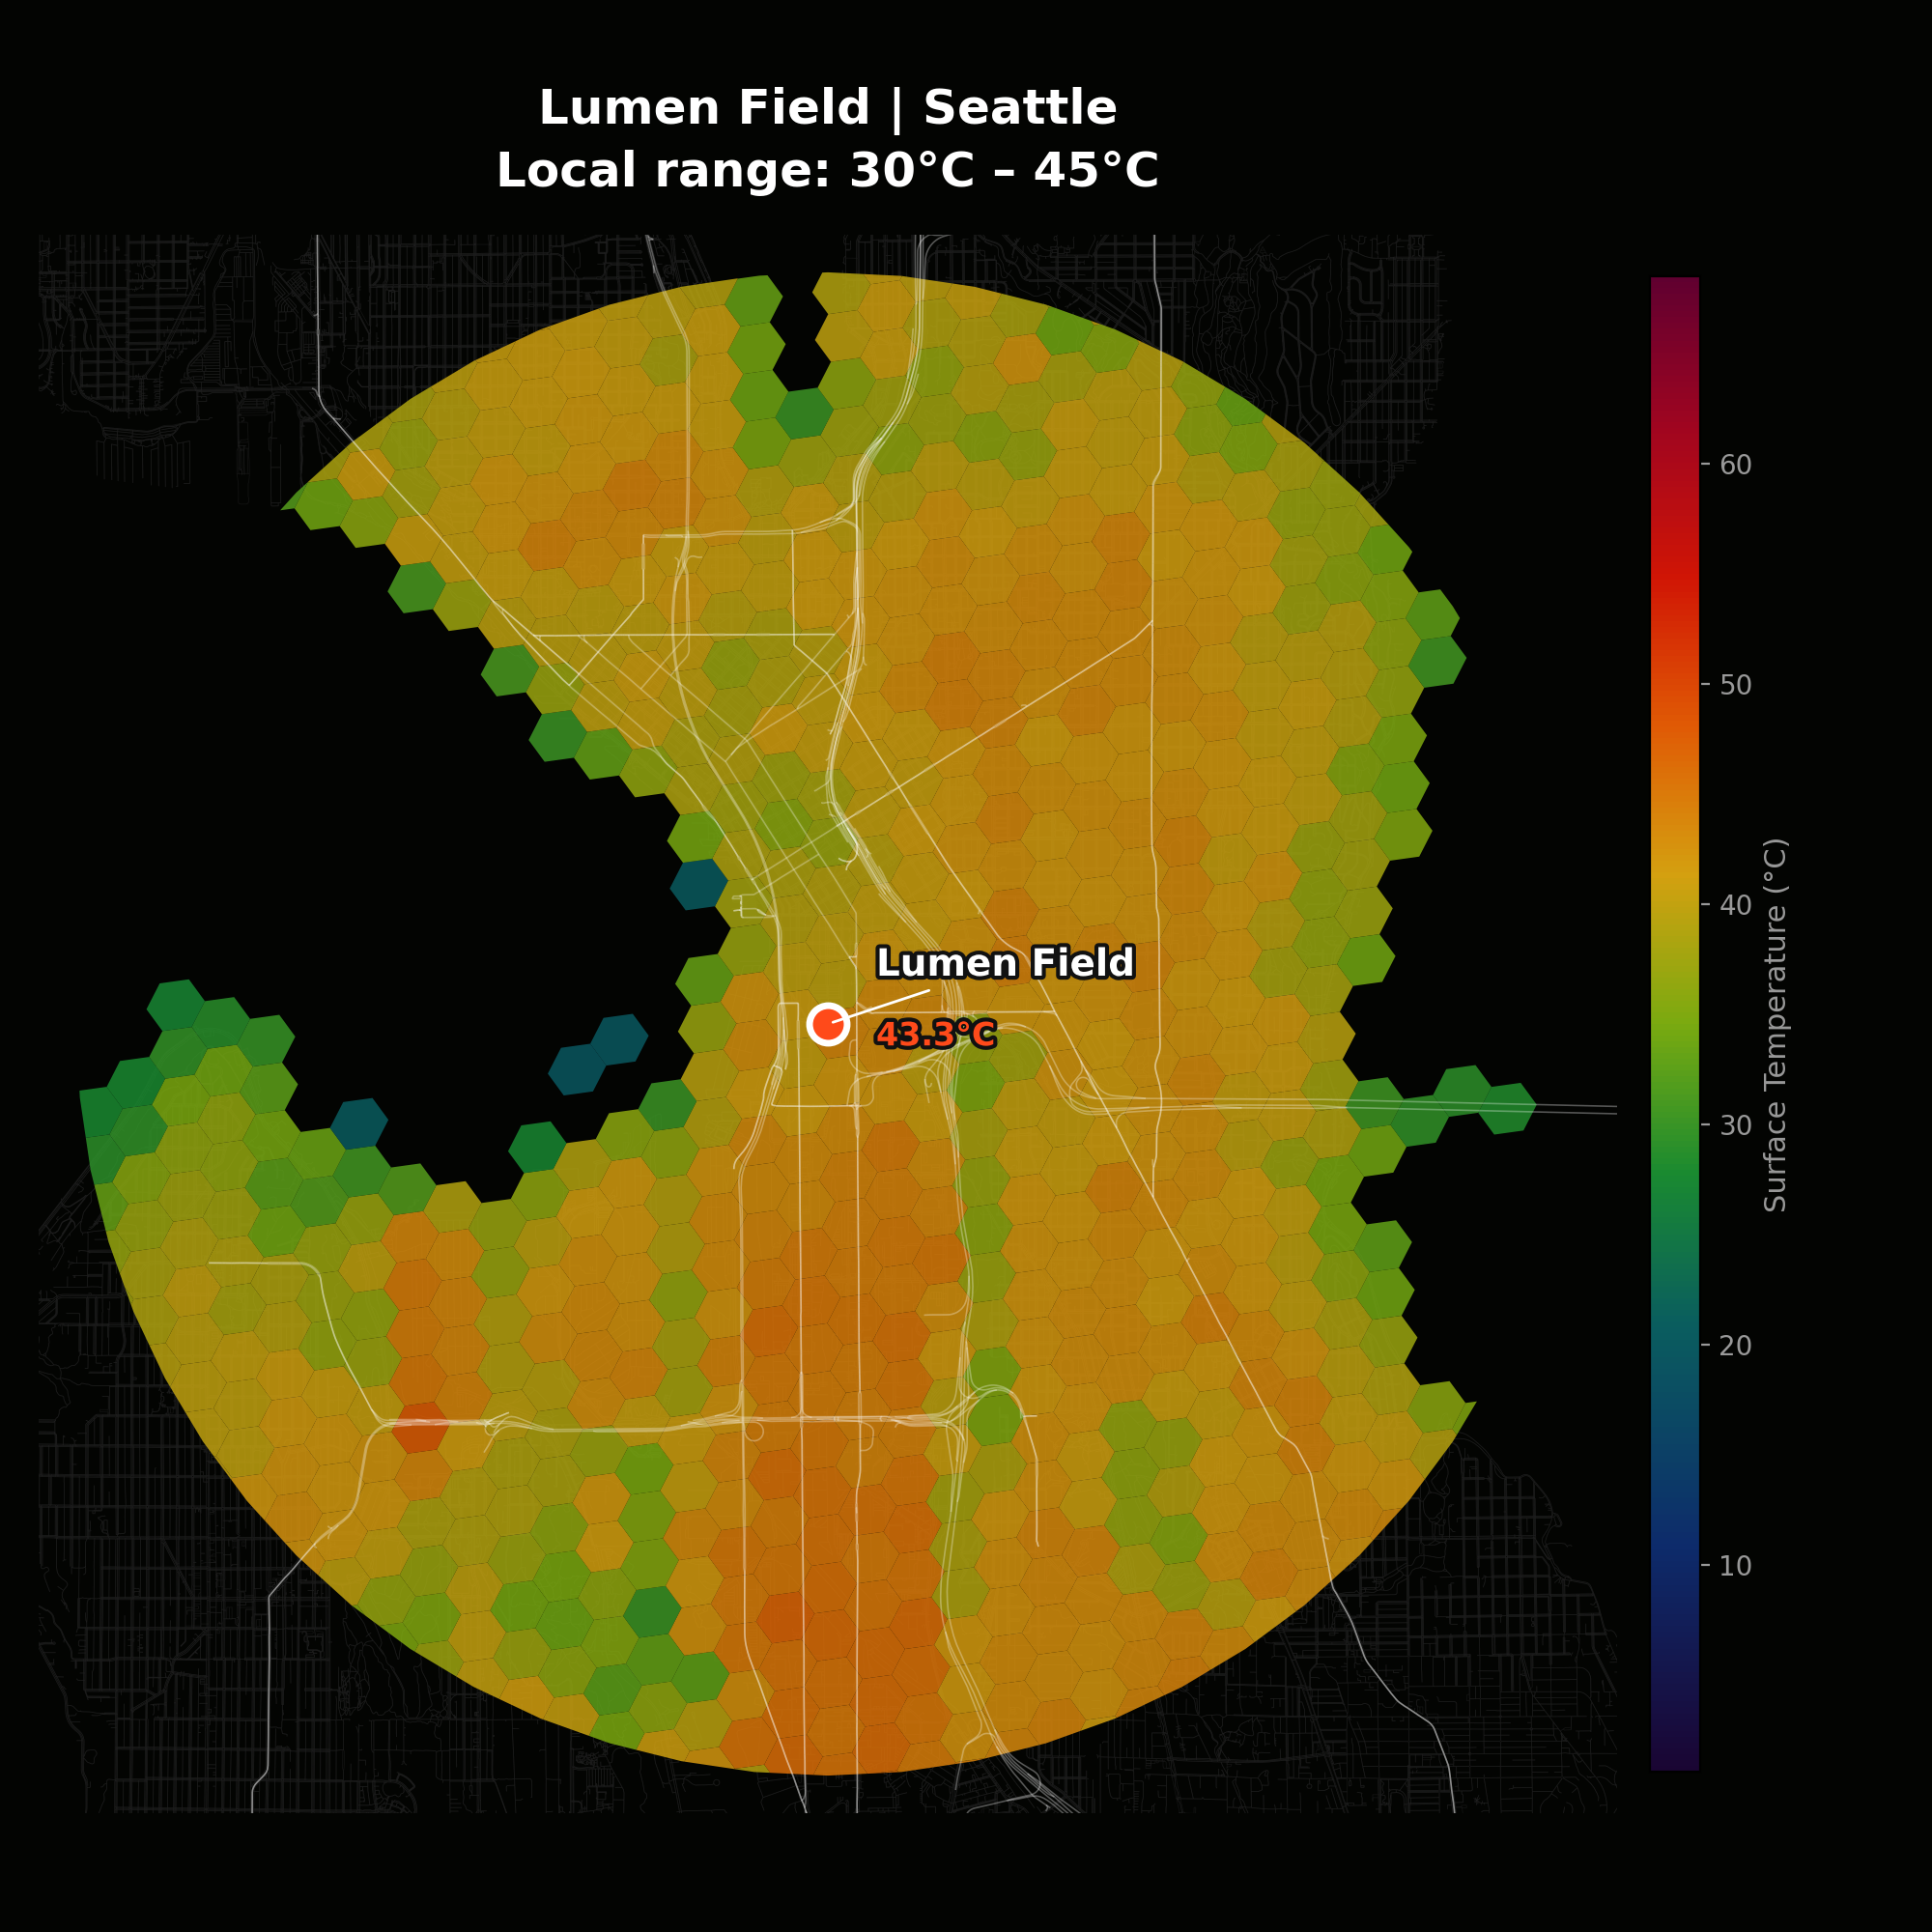 9. Seattle — 43.3°C
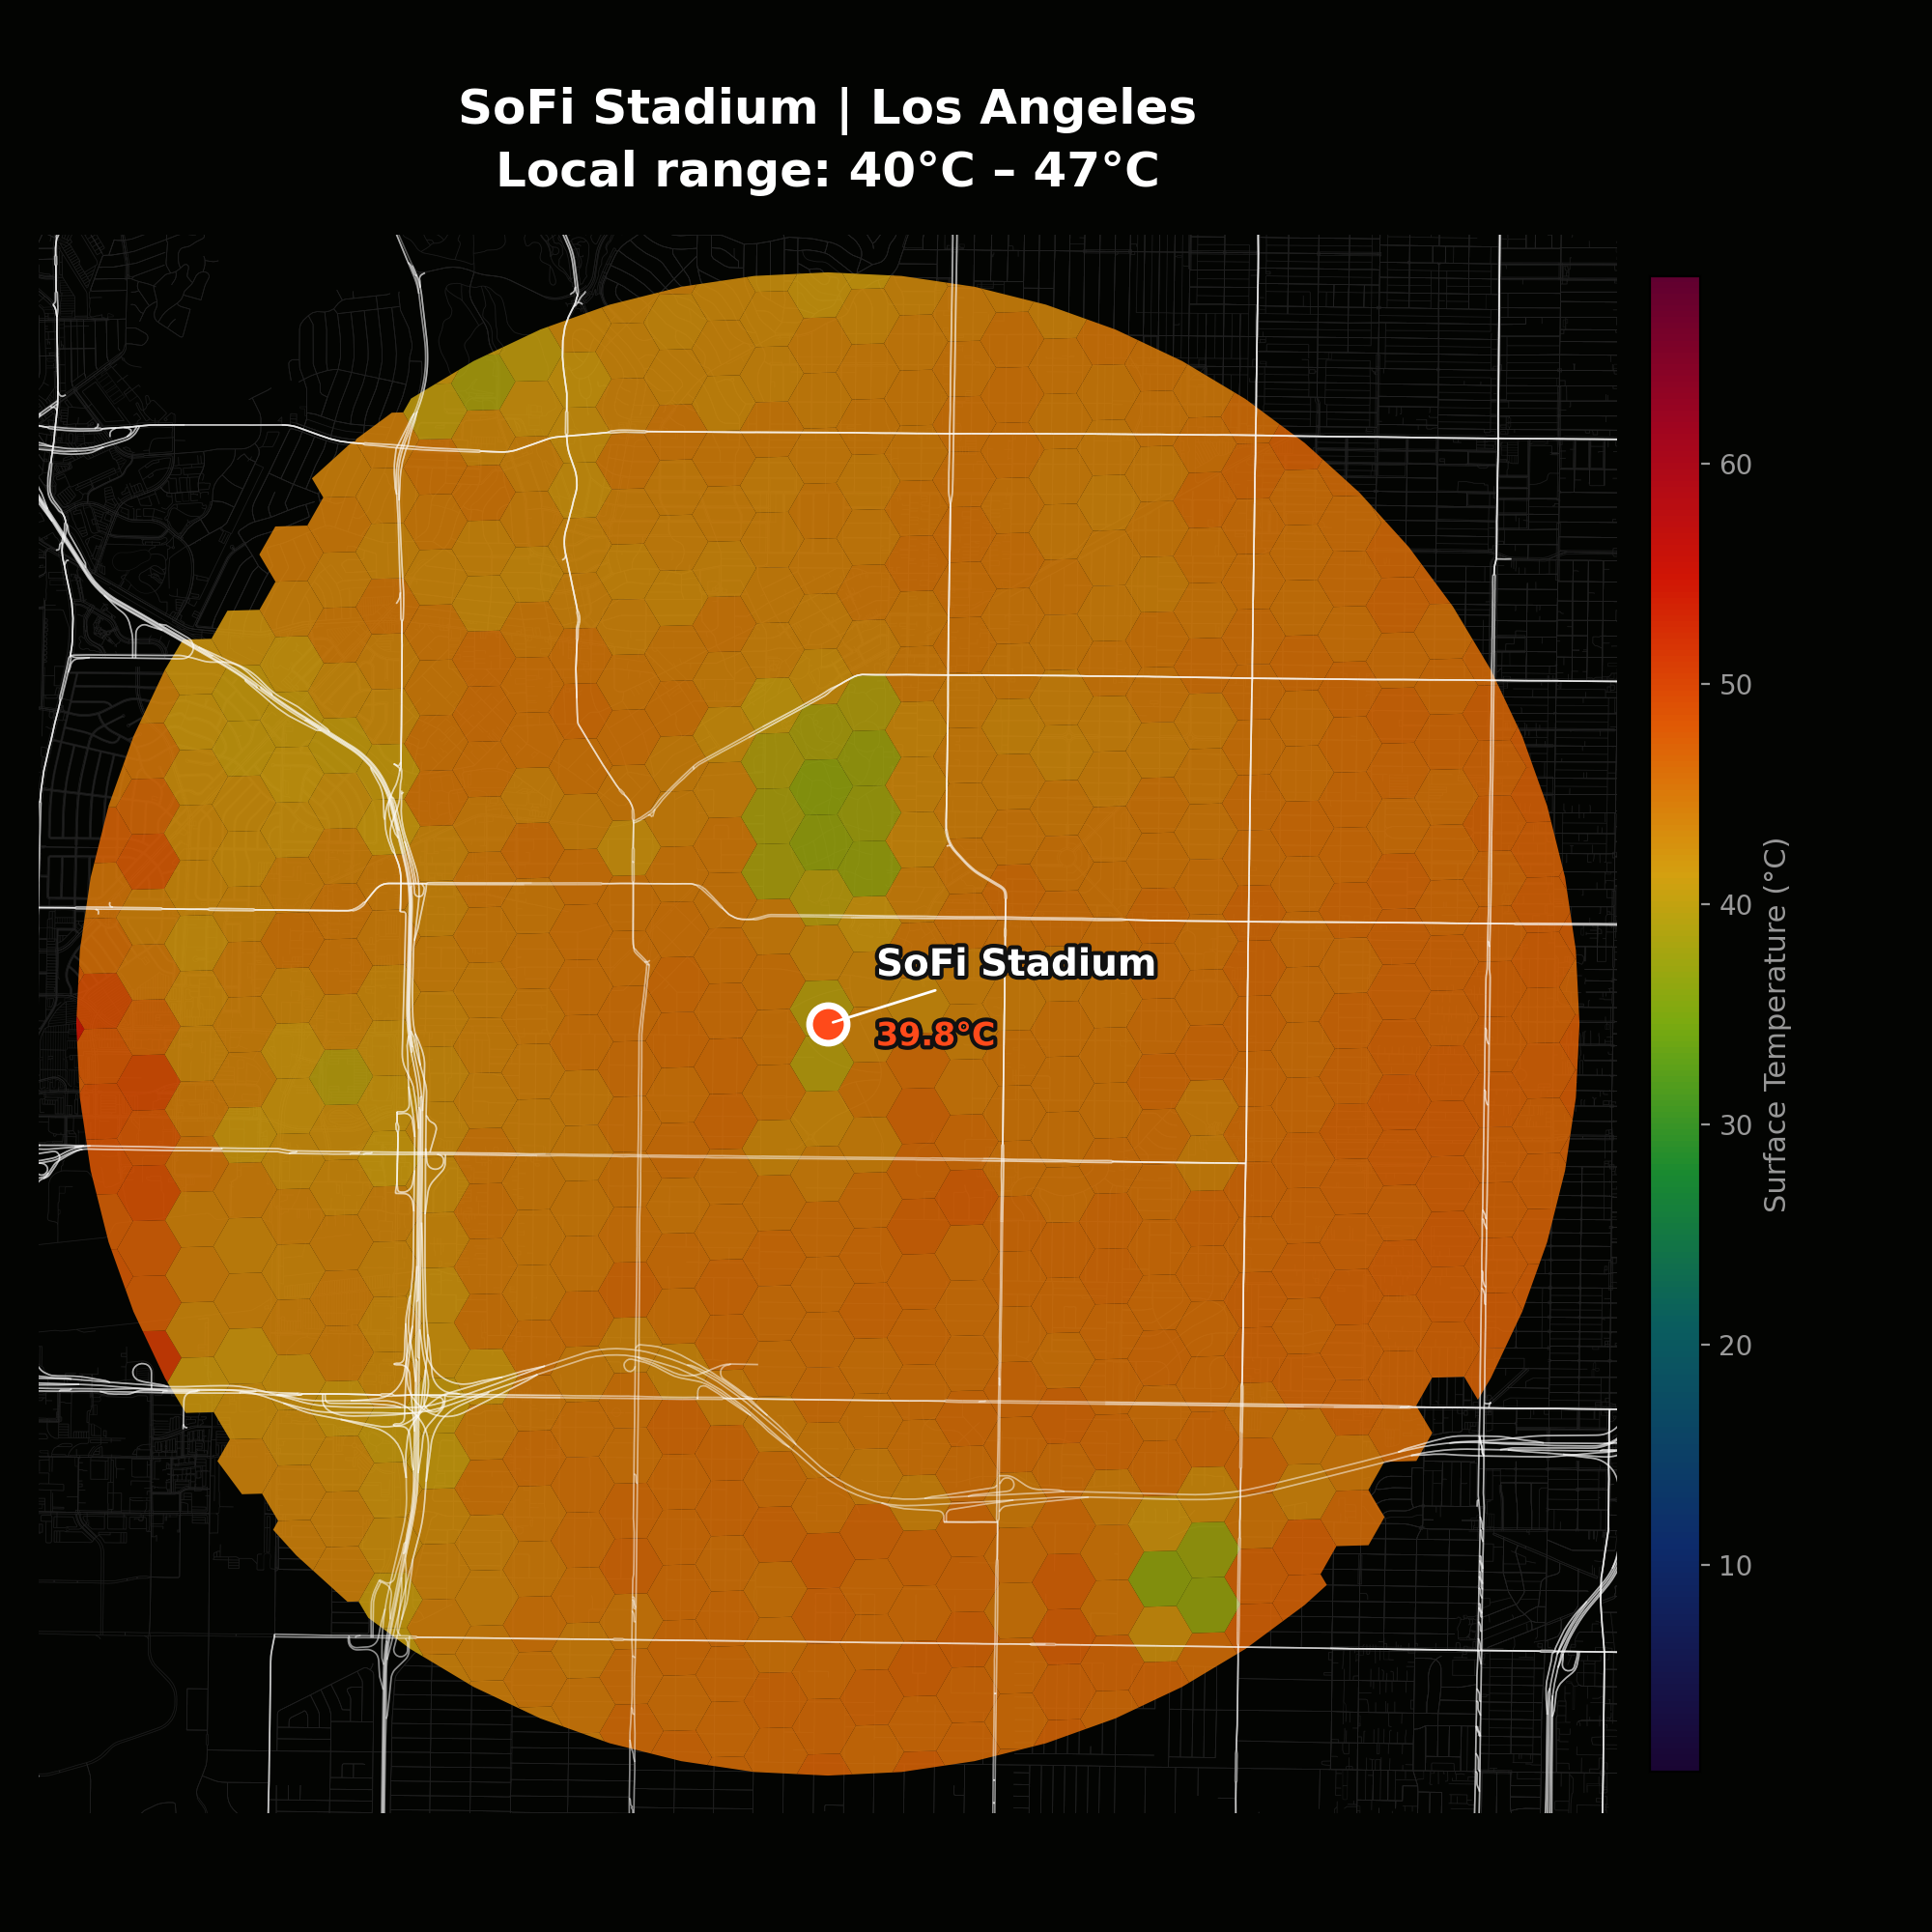 10. Los Angeles — 39.8°C
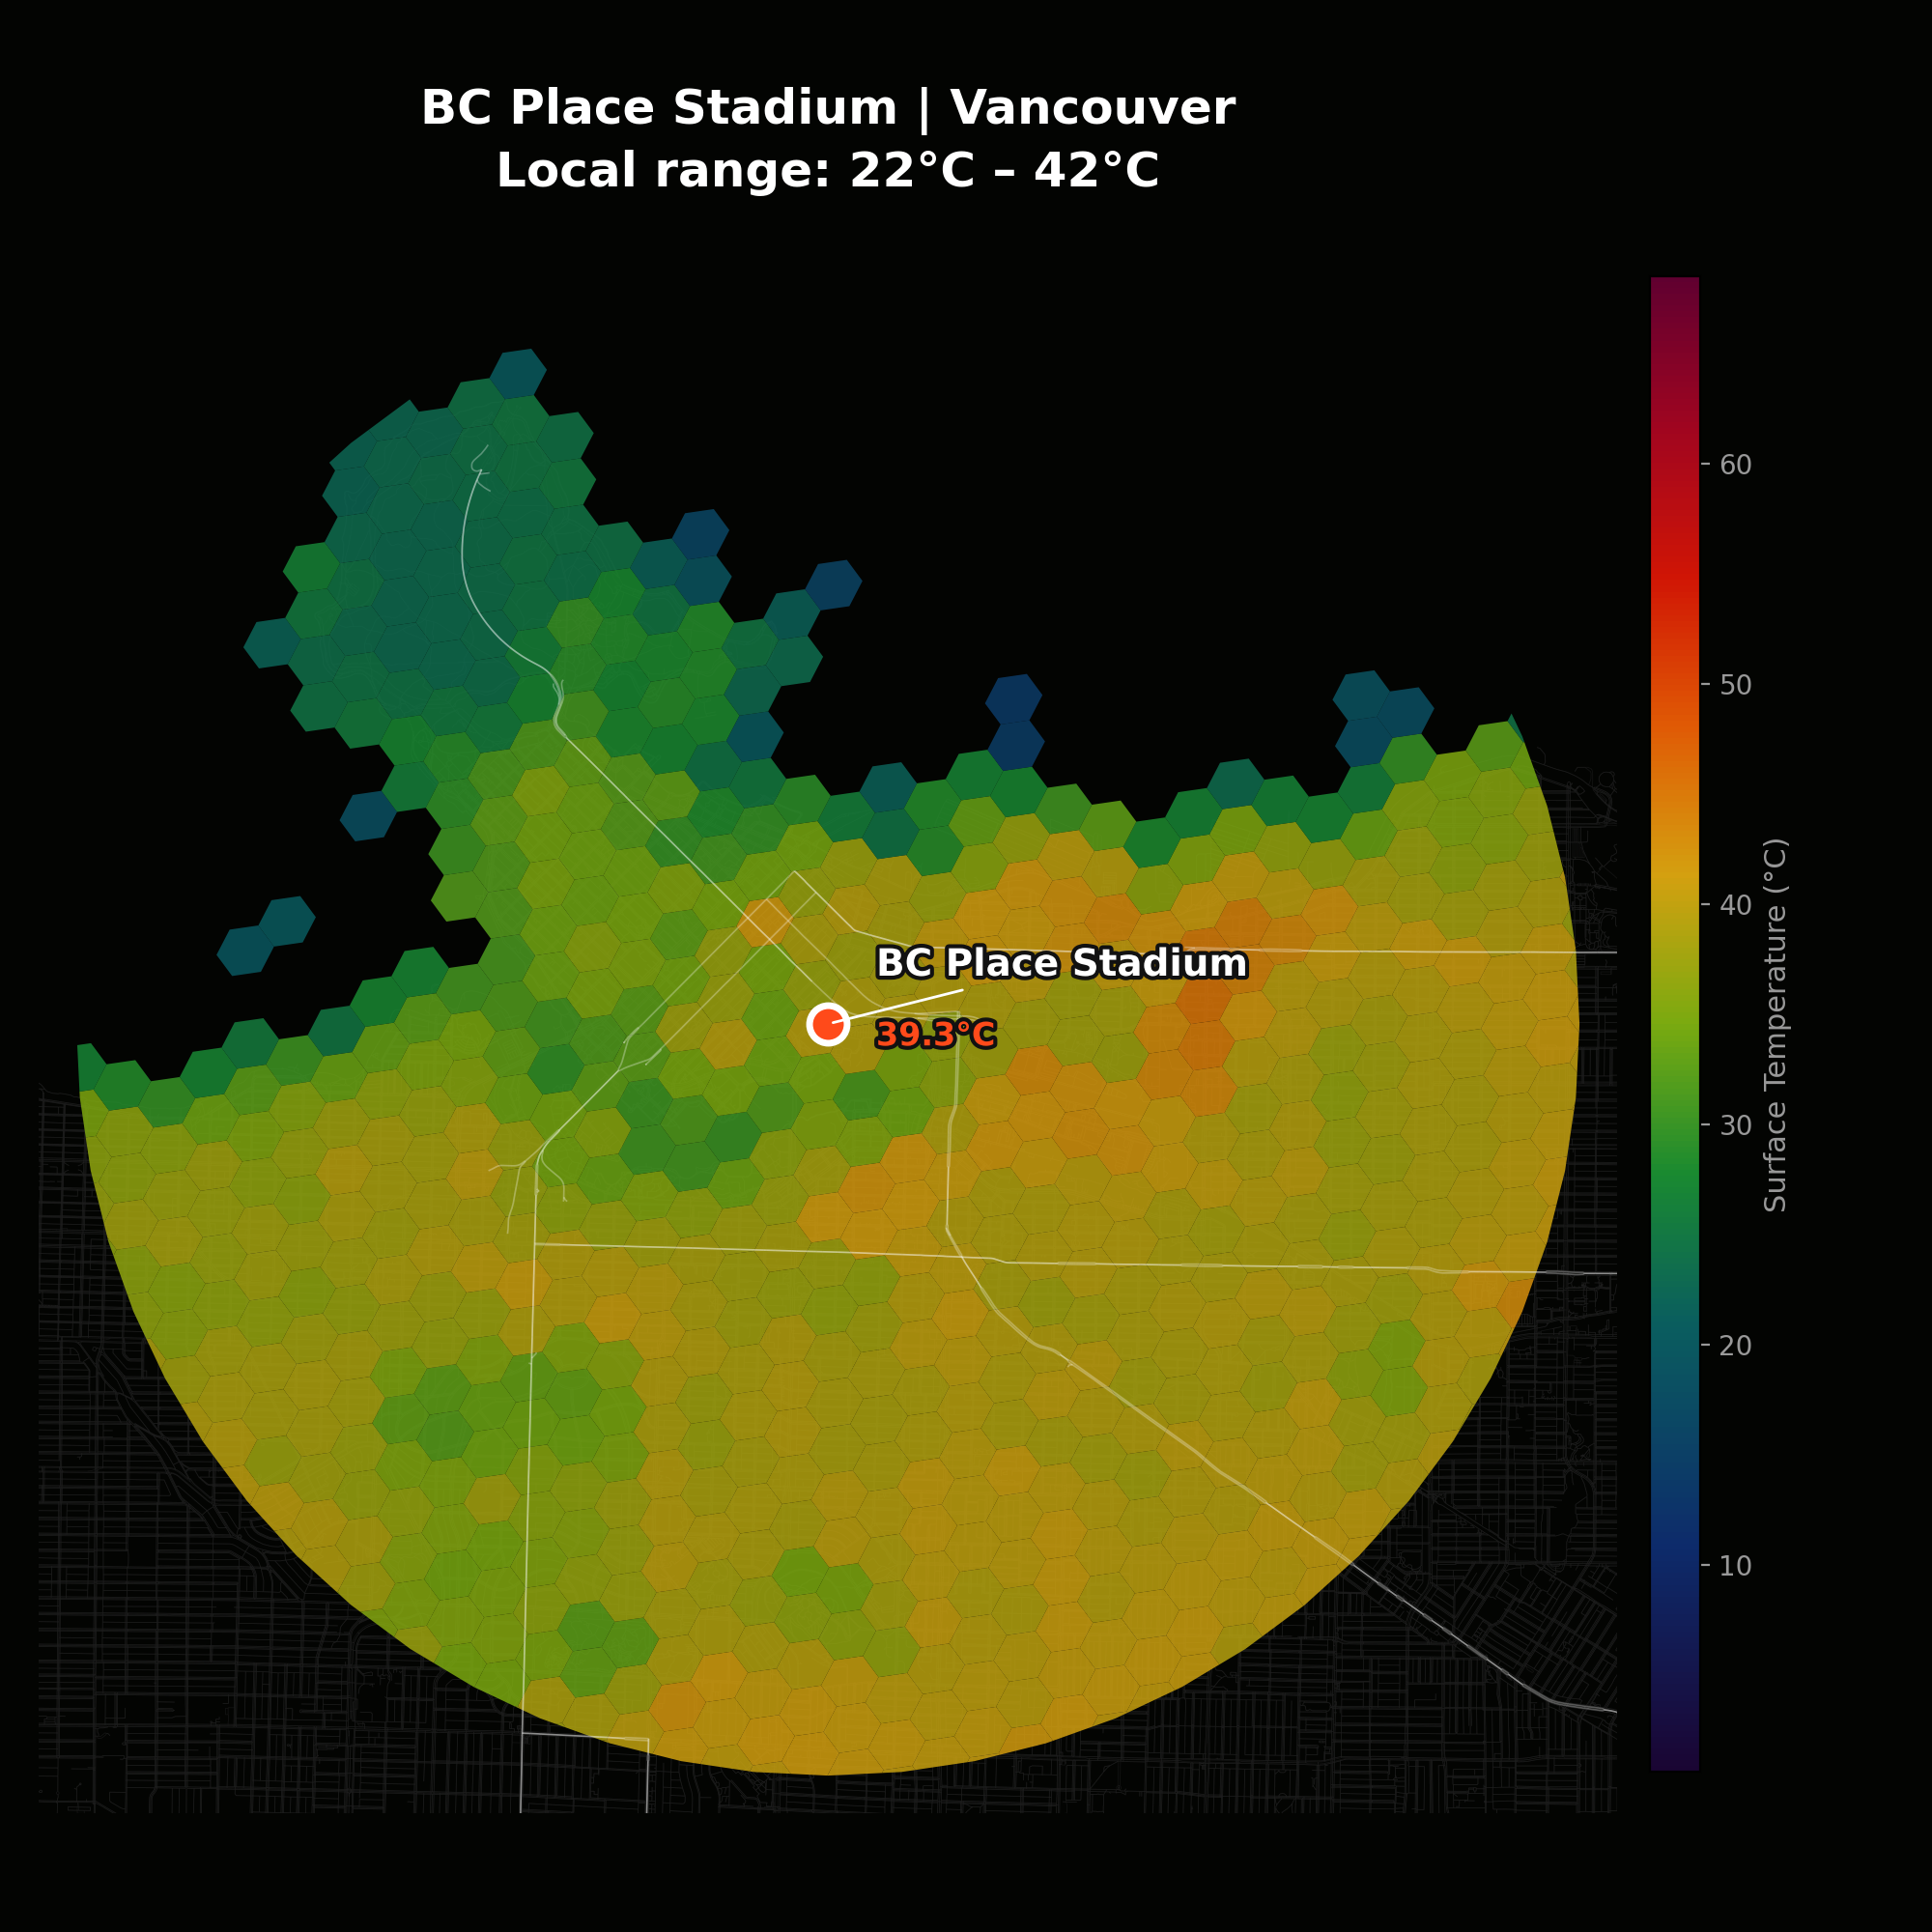 11. Vancouver — 39.3°C
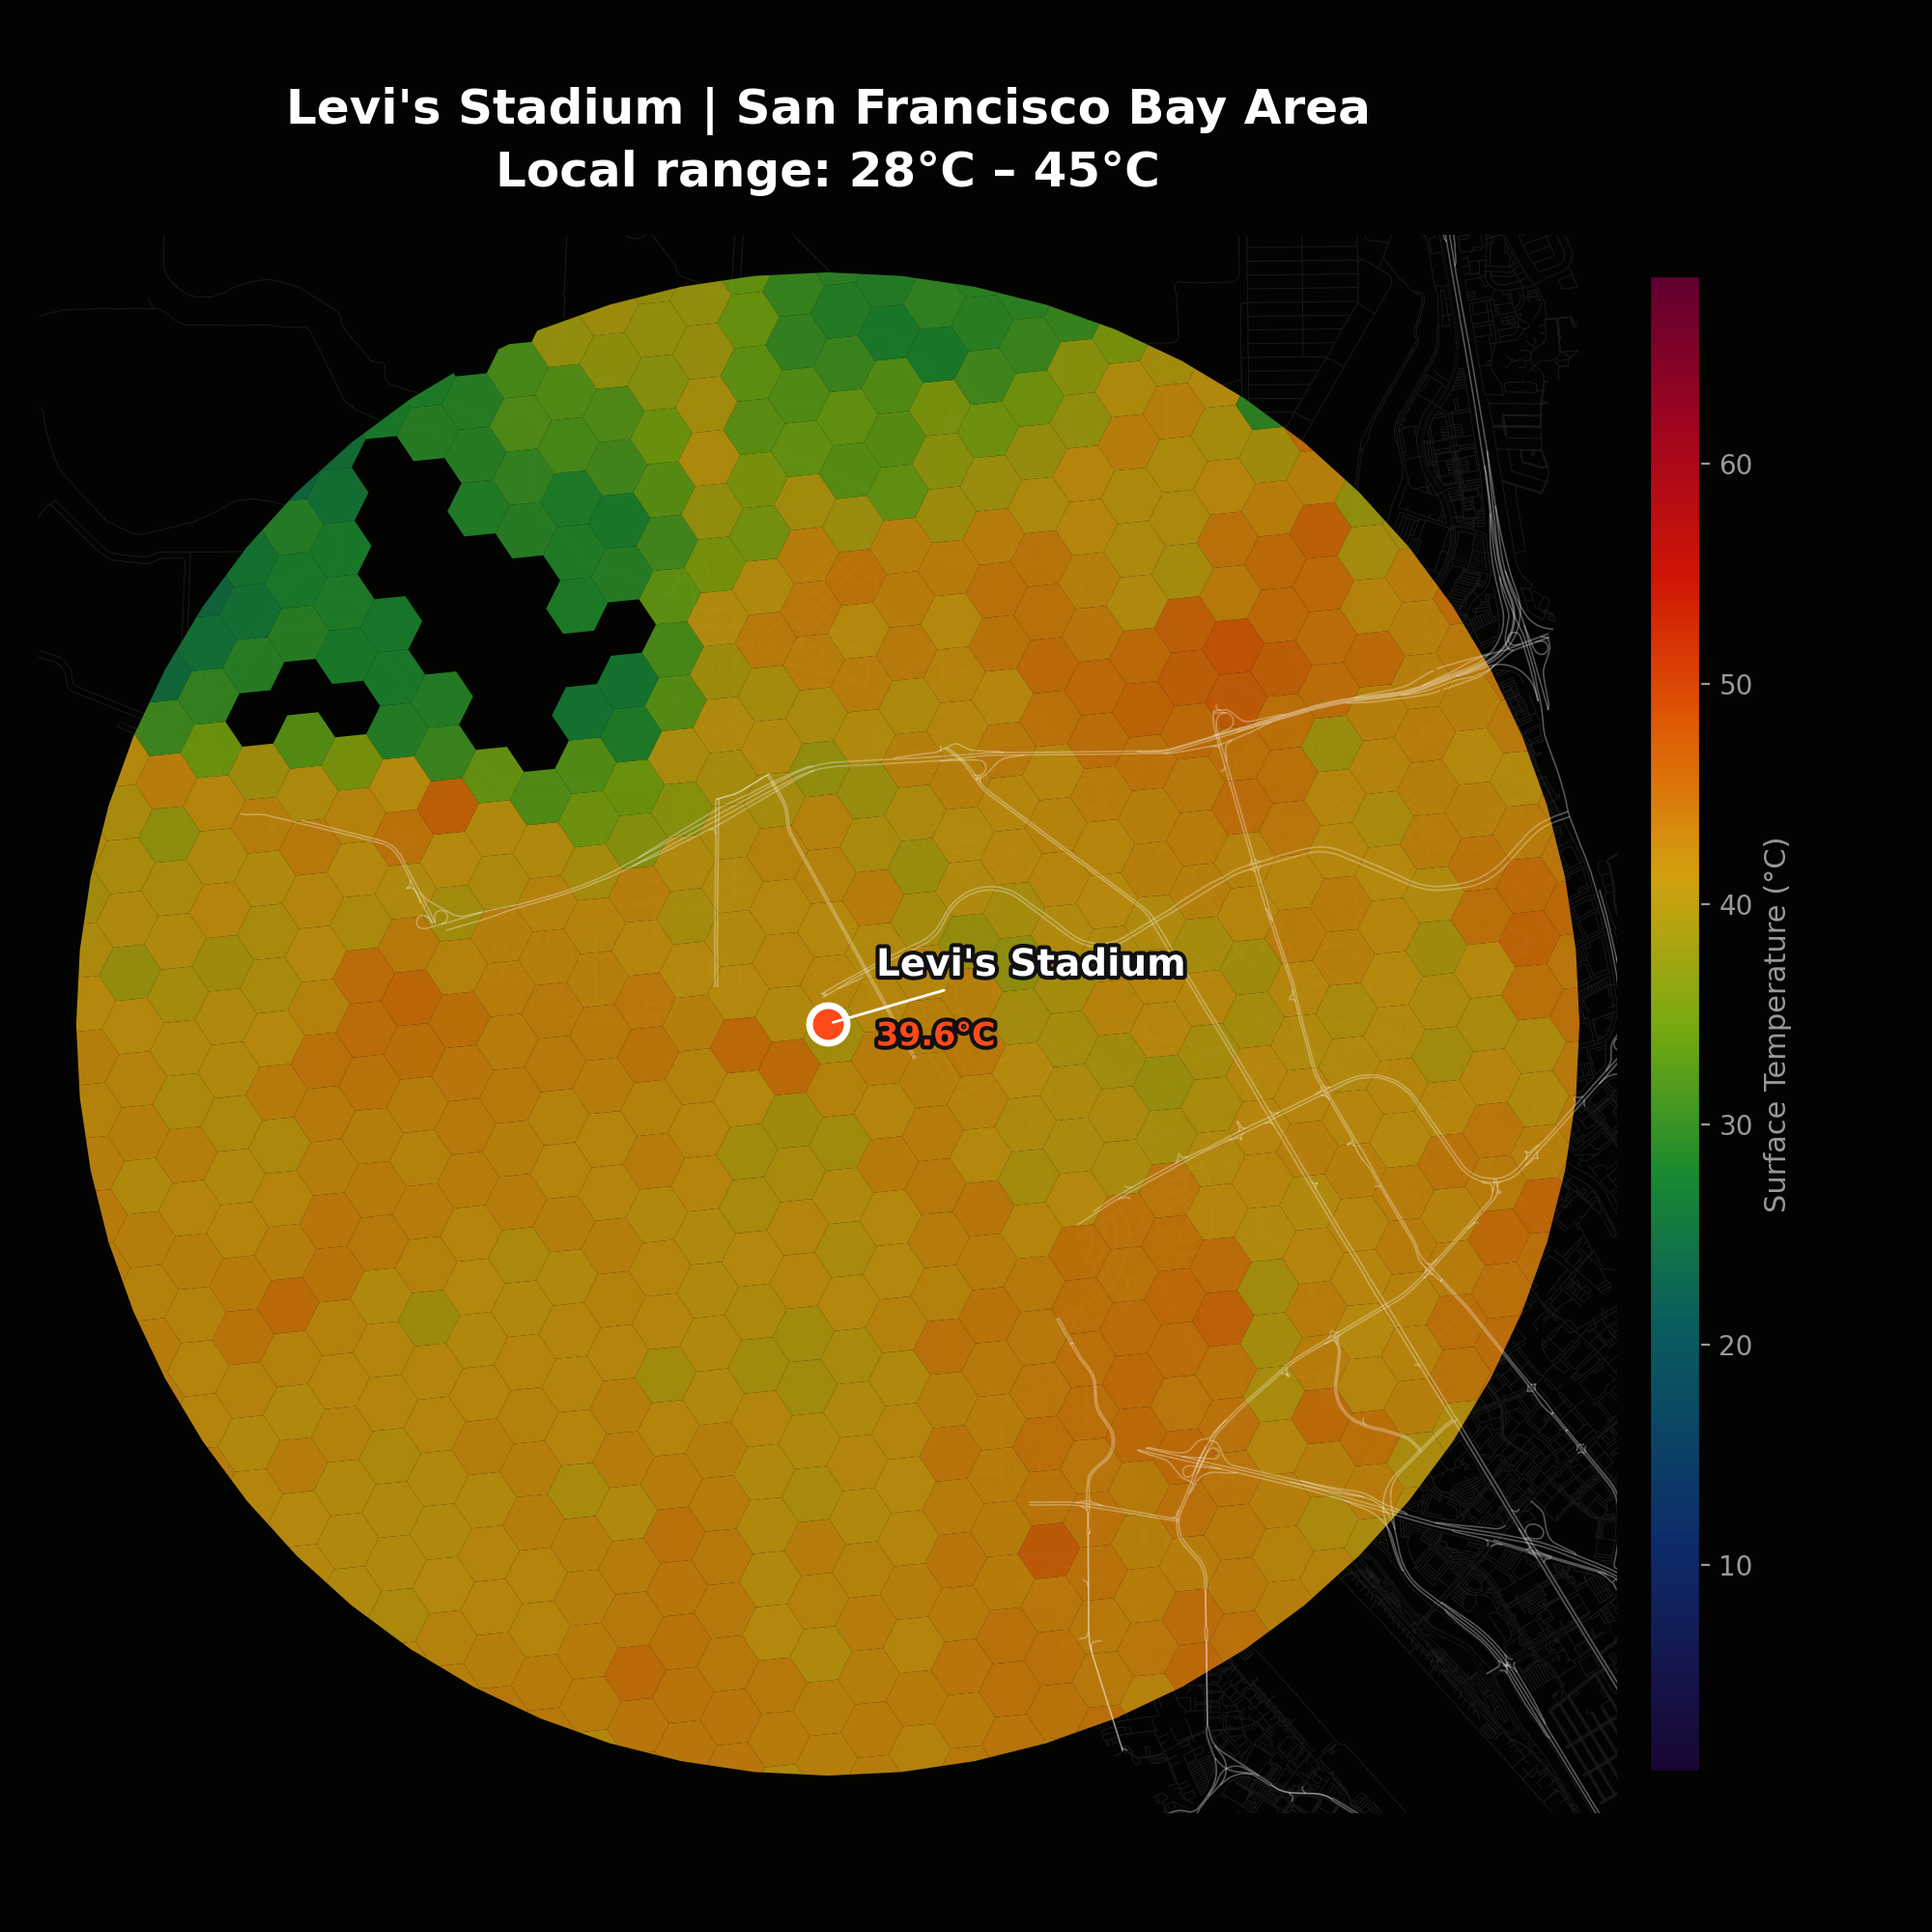 12. San Francisco — 38.8°C
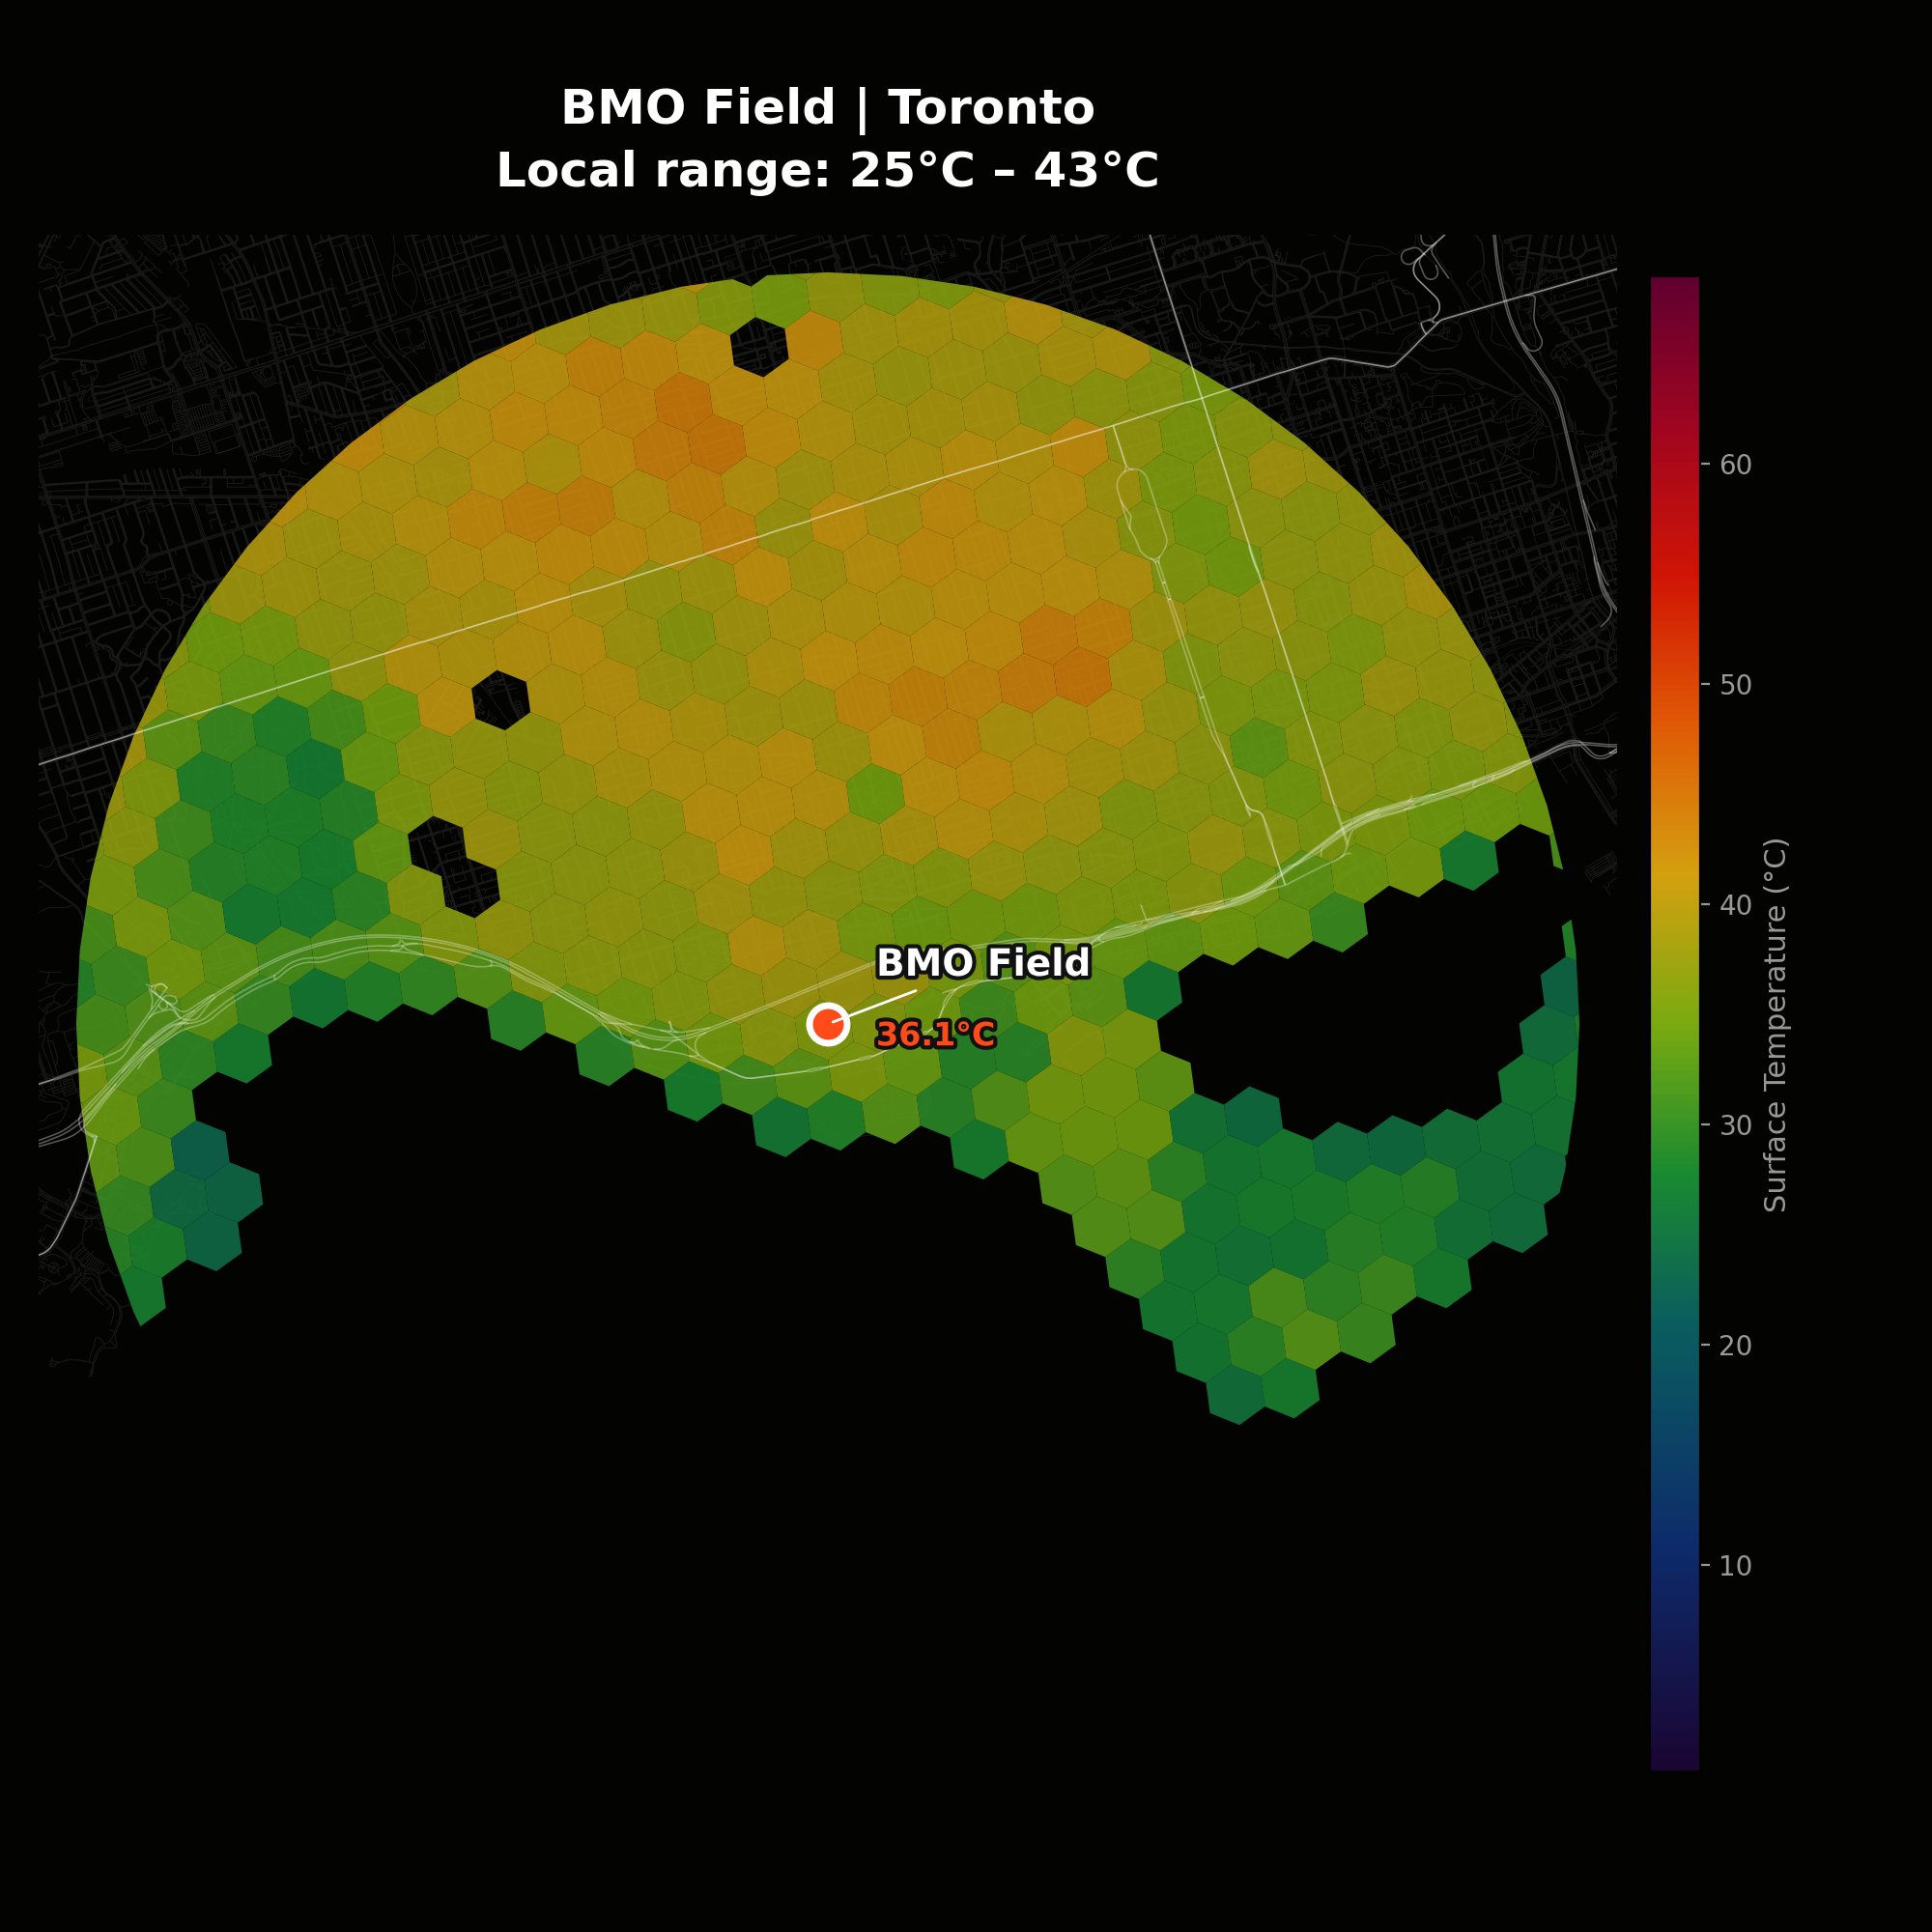 13. Toronto — 36.1°C
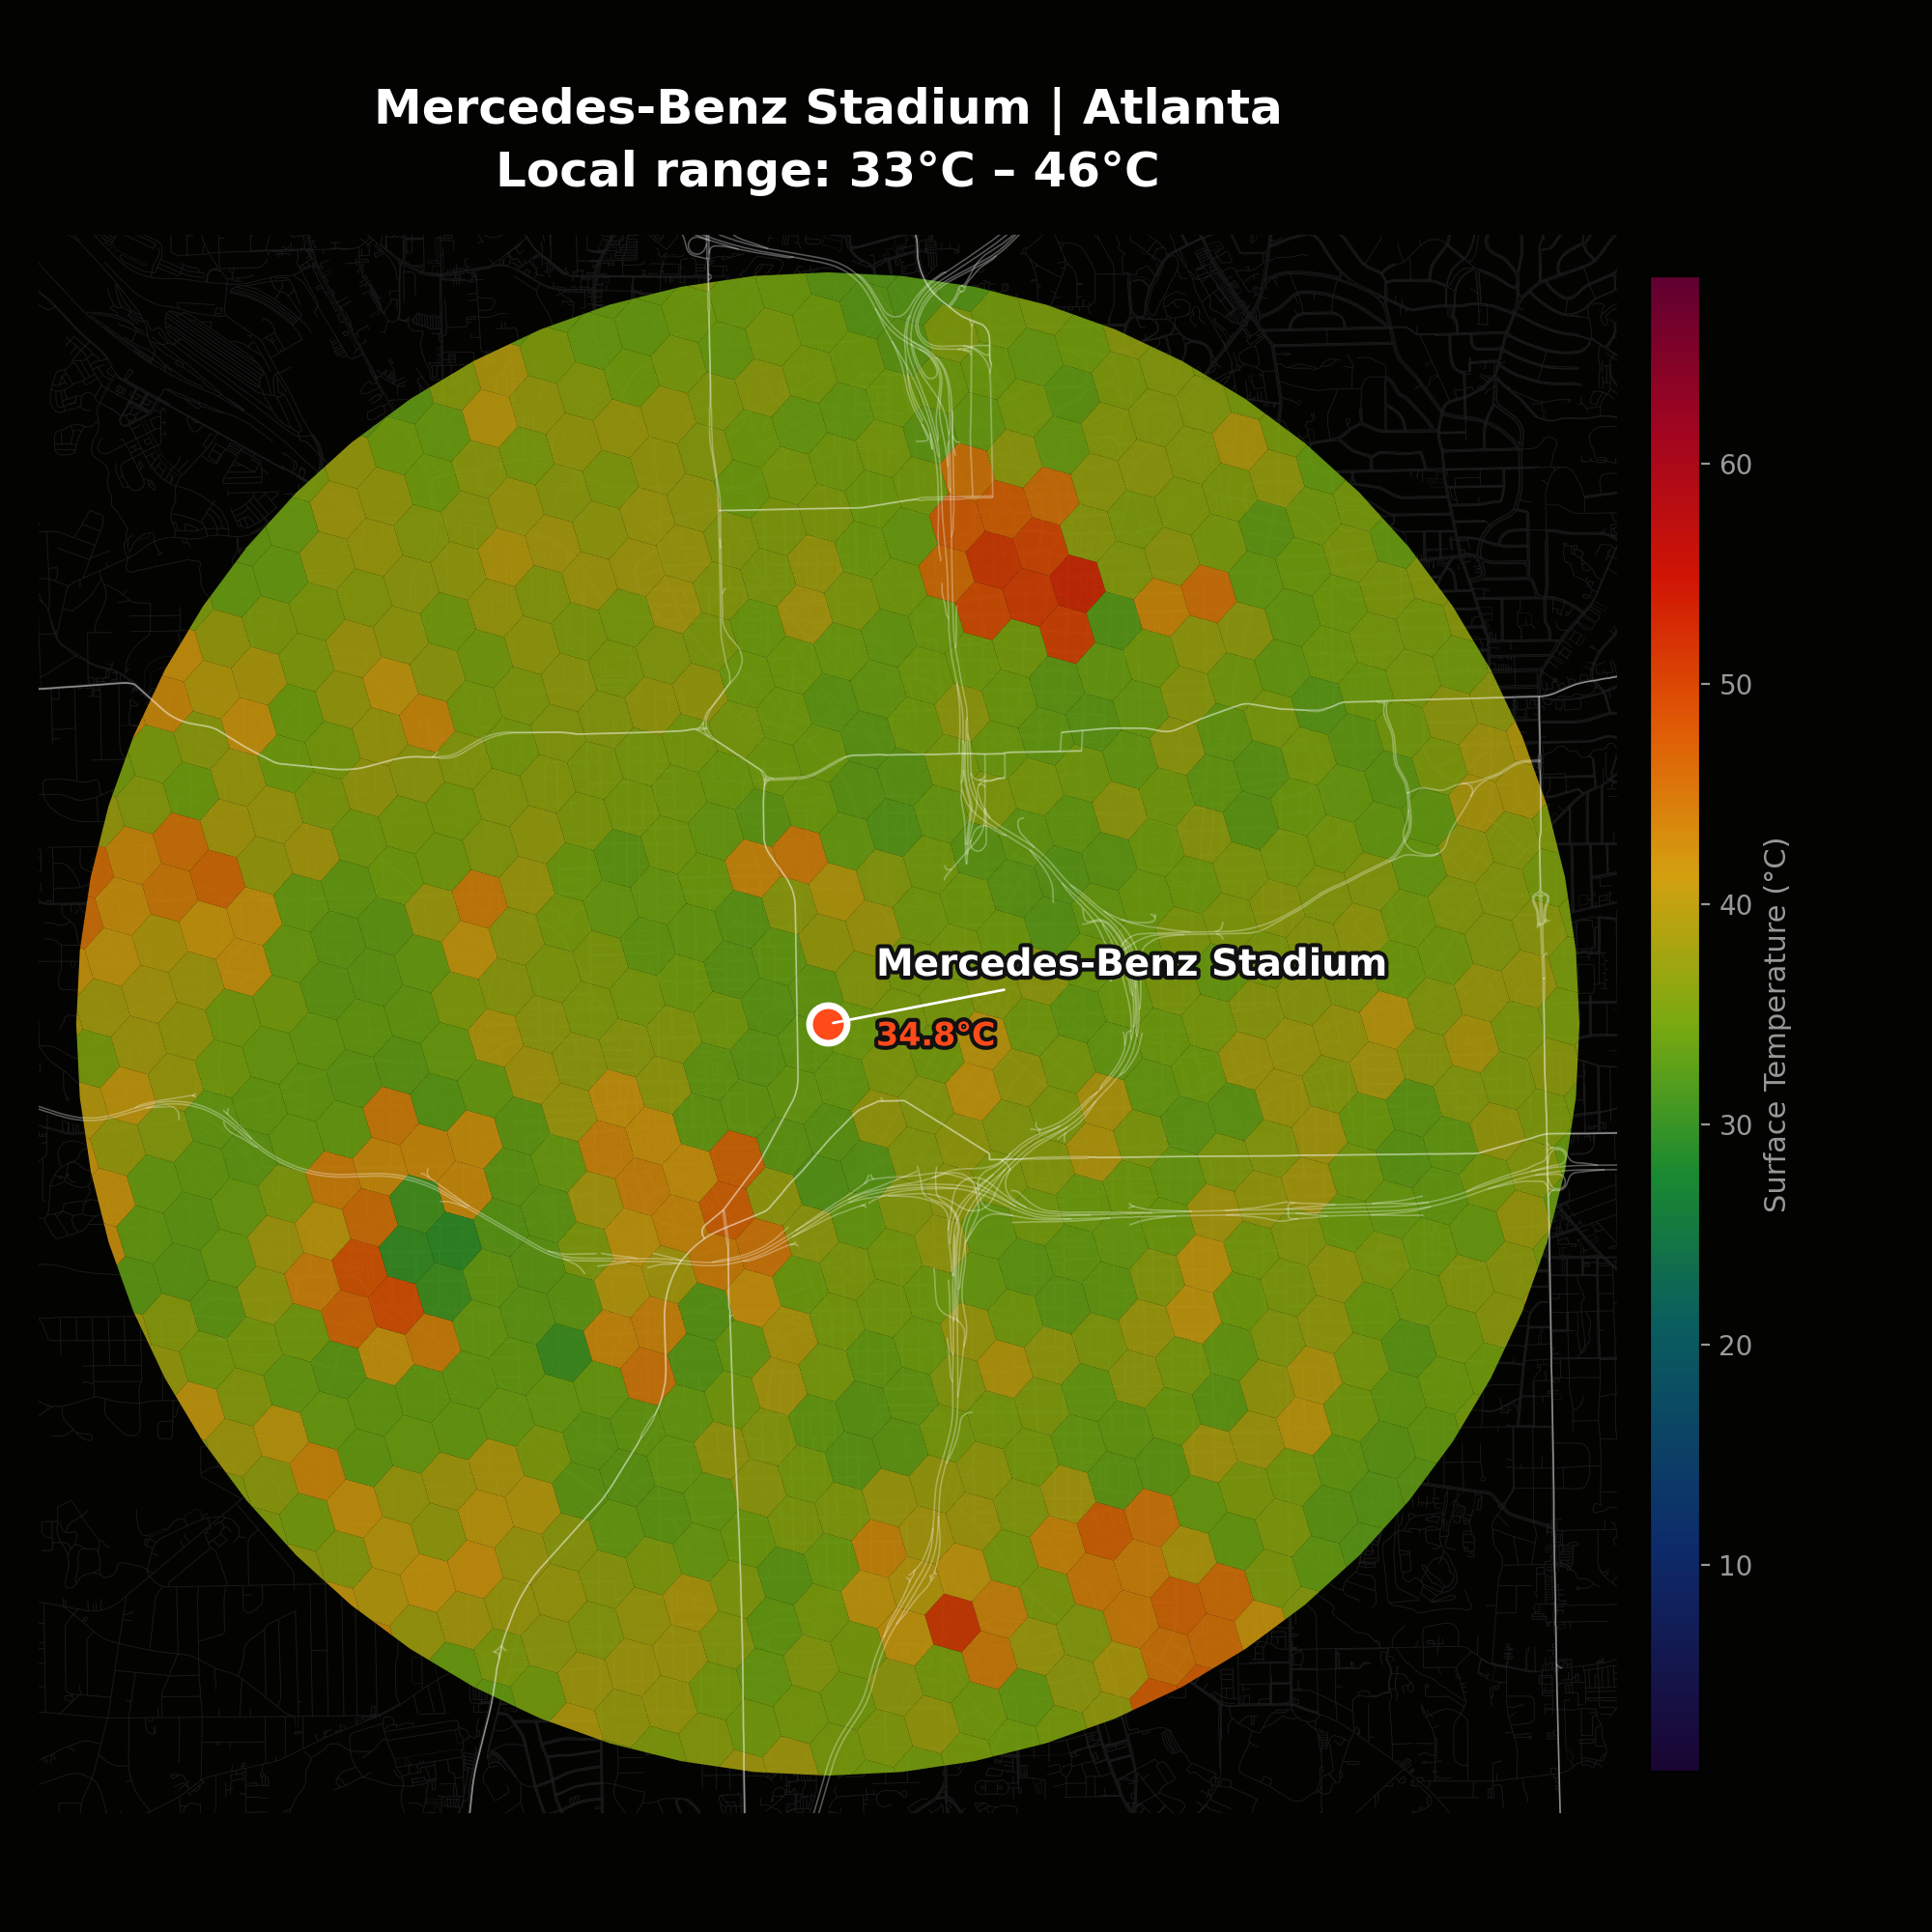 14. Atlanta — 34.8°C
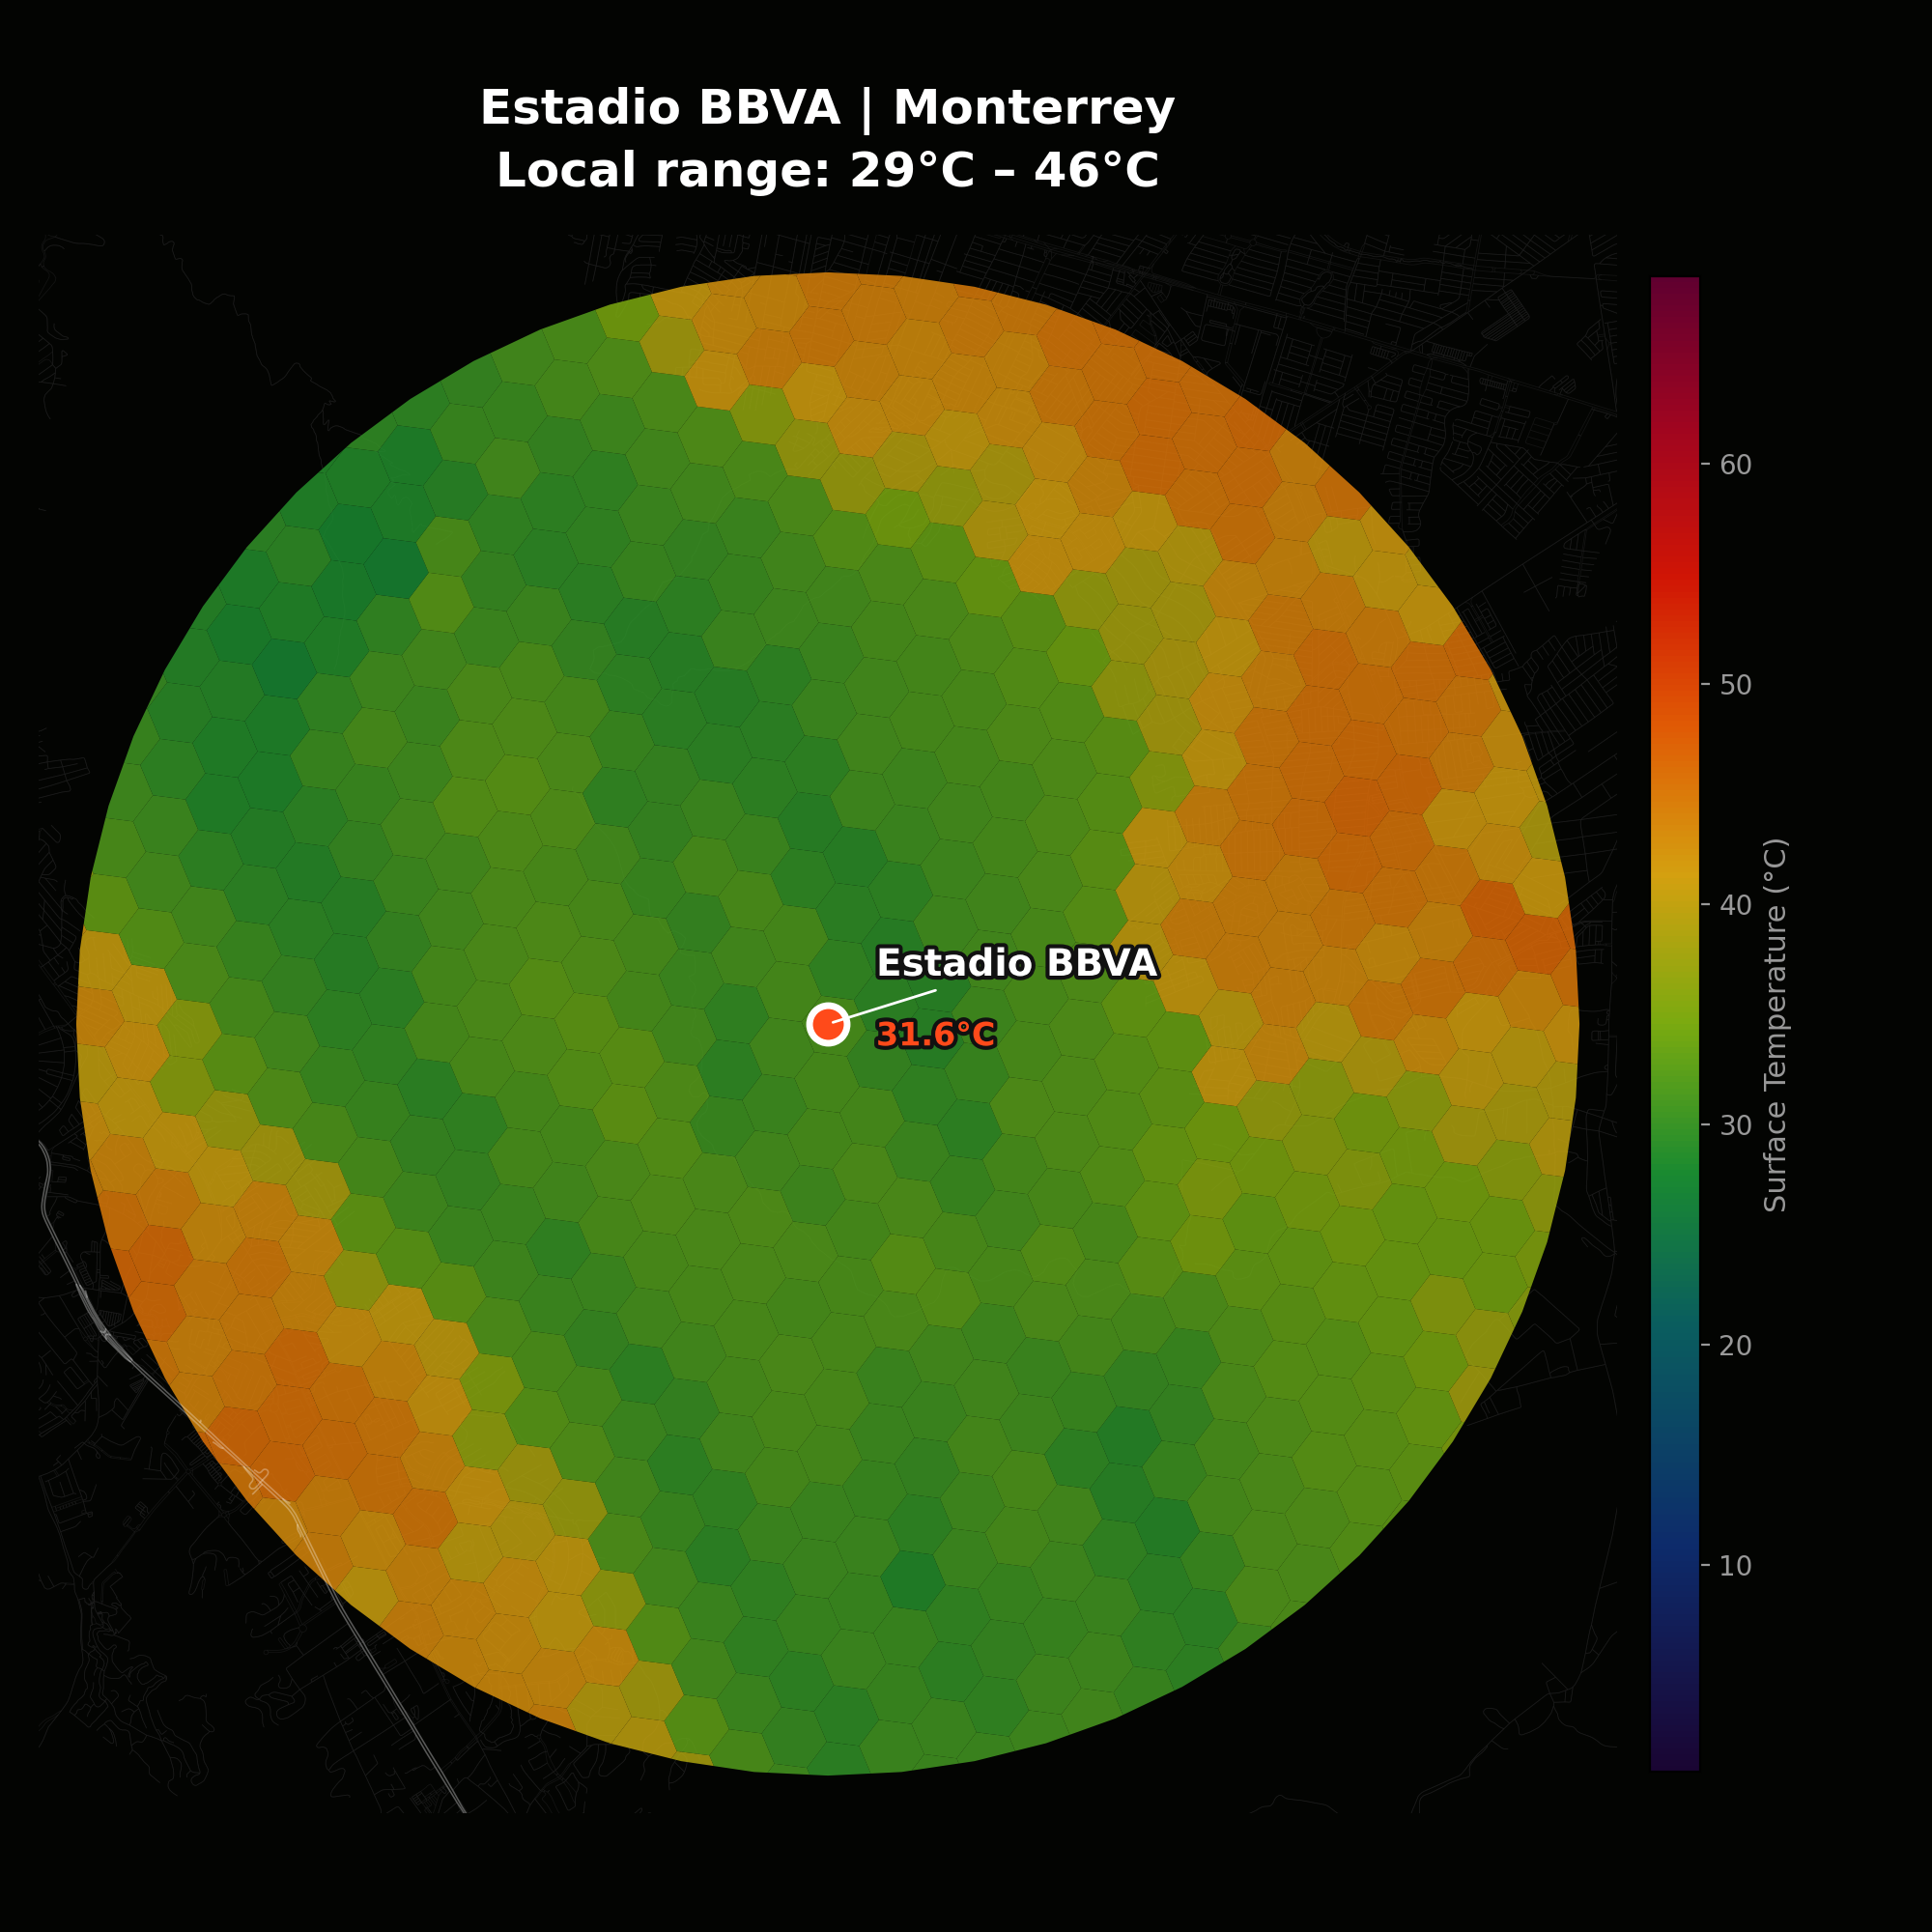 15. Monterrey — 31.6°C
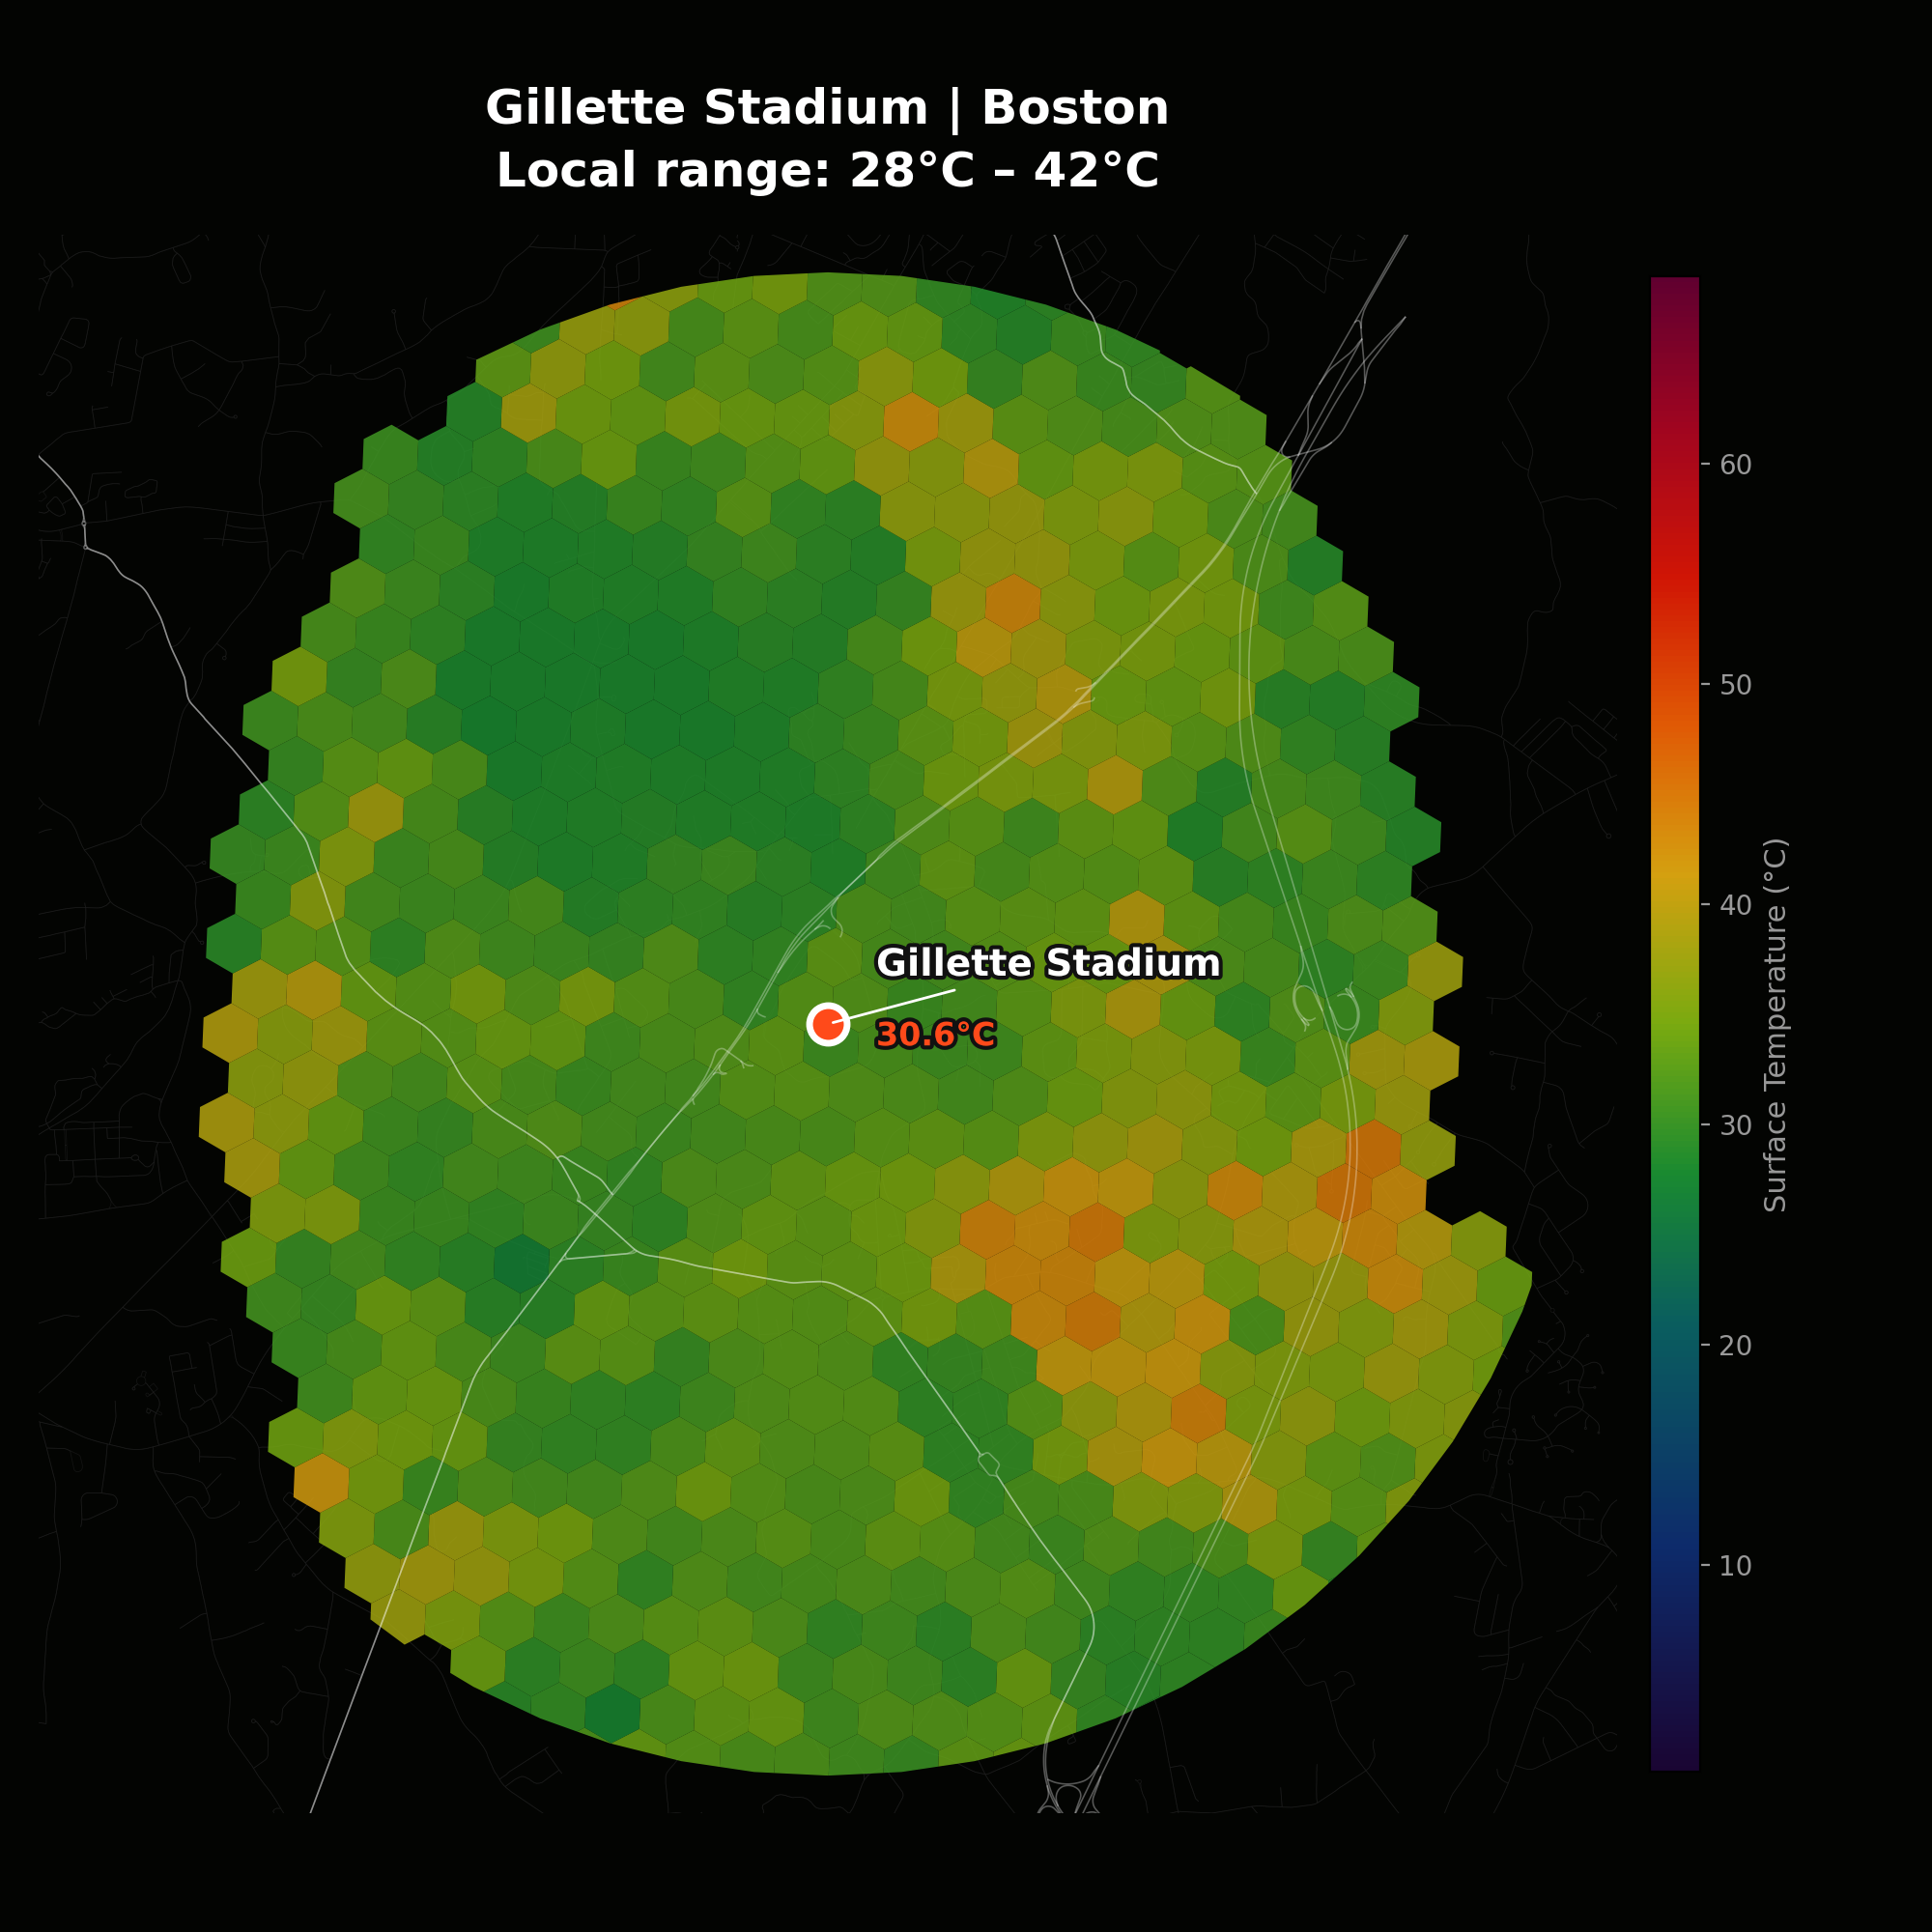 16. Boston — 30.0°C
In every city we mapped, the parking is the hottest surface in the neighborhood. Building car-centric infrastructure comes with consequences that affects the neighborhood and the city.
Guadalajara has the widest gap: 19.4°C between the coolest park and the hottest pavement near Estadio Akron. Atlanta has the smallest at 11.3°C because the tree canopy compresses the range. Most cities fall between 13 and 20 degrees.
Kansas City's Arrowhead sits at the 99th percentile of its metro's heat distribution, the hottest spot in the city. Most stadiums rank above the 50th percentile.
Green = park/green space (coolest 5%). Orange = stadium. Red = parking/asphalt (hottest 5%). Percentile shown per city.
In Vancouver, the hottest 5% of hexagons have an NDVI (a satellite measure of greenness) of 0.04, while the coolest 5% score 0.31. That is a sevenfold difference, and the pattern holds in every city we mapped.
Kansas City's coolest cells are three times greener than its hottest. Atlanta is the outlier because even its hot spots have trees (NDVI 0.31), the city is built inside a forest canopy and it has the smallest thermal gap of all 16 metros.
Every stadium parking lot in this study falls on the magenta end of the spectrum: hot surface, no canopy. The most effective cooling strategy in every city we mapped is vegetation.
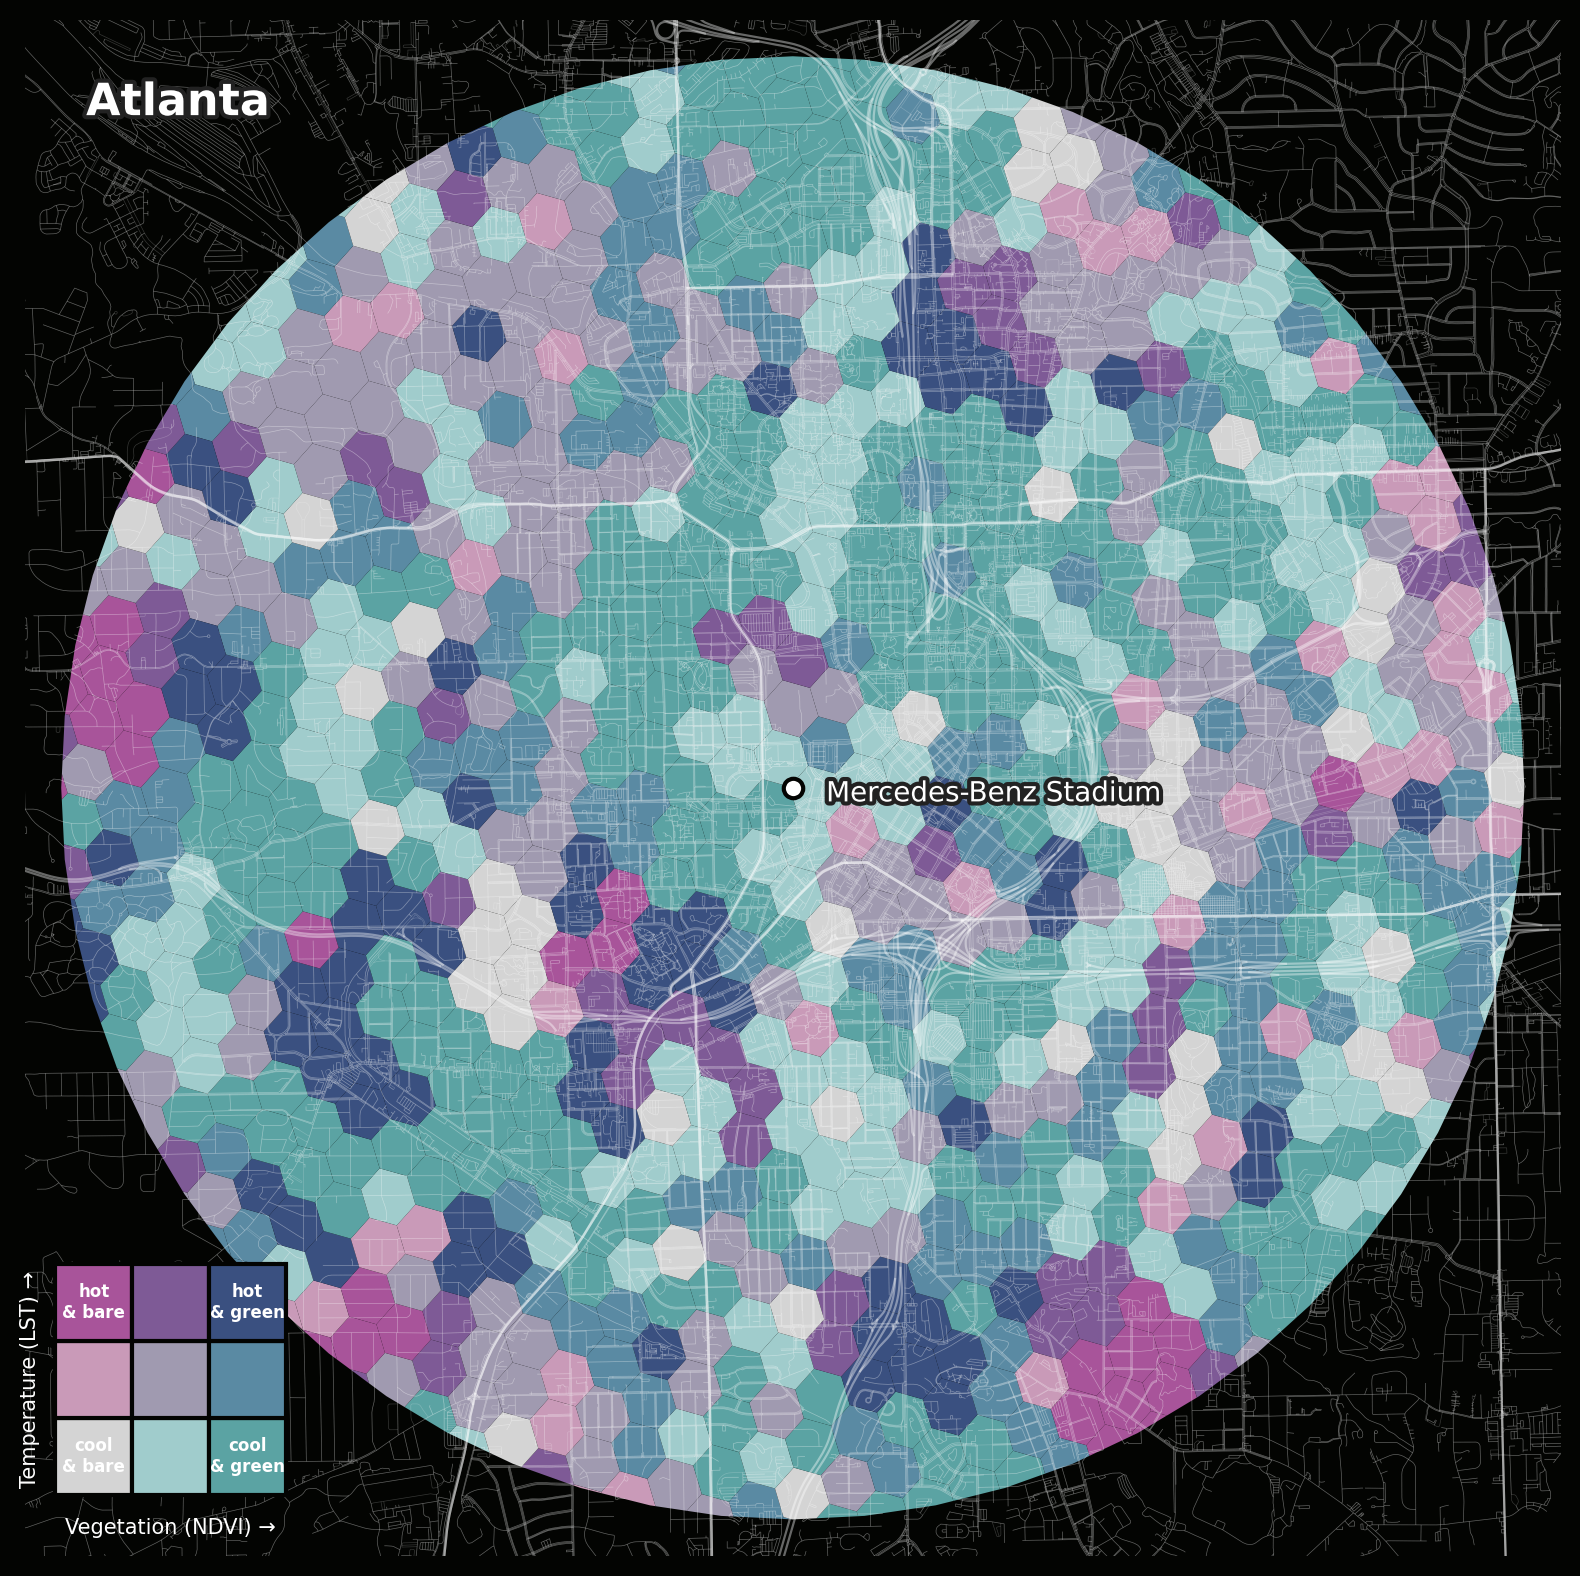
Magenta = hot and bare. Teal = cool and vegetated. 5 km radius around the stadium. Click to enlarge.
We build urban climate analysis for cities, venues, and organizations that want to understand their heat exposure before it becomes a problem.
hi@tynstudio.com